


The Movable Middle: 5 Predictors of Potential ROI
Inside every customer file, there are hidden opportunities.
Customers who haven’t been fully engaged. Customers who spend but aren’t spending with you. Customers who have the potential to be VIPs tomorrow but are middling today.
These customers represent significant ROI. And they can generally be reactivated with less effort and more payback than acquiring a brand new customer, improving the efficiency of your marketing spend and resources.
At Bluecore, we call this segment of a retailer’s customer file the movable middle.
The movable middle are customers who have a distinguishing characteristic that makes them more valuable than they would otherwise appear. For example, one-time buyers from the previous year have the potential to convert into repeat customers, while recently inactive shoppers can be brought back with some slight nudging.
With the right data, you can spot subtle characteristics and signals, use them to build cohorts, and start working to move these potentially high-value customers through your funnel.
In this article, we will look at five data predictors you can use to identify the movable middle and convert them into profitable VIPs.
Predictor 1: Website Behavior Data
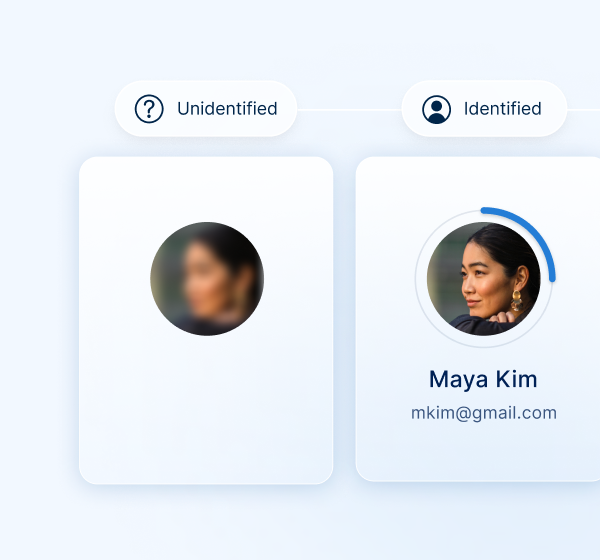
Customers provide nonverbal shopping cues every time they visit your store.
In person, skilled reps know how to assess body language, facial expressions, and eye movement when assisting customers. With strong shopper identification technology set up, you can identify similar signals when customers enter your digital sales channels, adding valuable data to your customer file.
Where the data comes from
Website behavior data is derived from analytics tools that track multiple aspects of customer interactions across a retailer’s website.
Google Analytics and specialized ecommerce platforms provide comprehensive tracking capabilities. Similarly, JavaScript snippets and purchase pixels can be added to your website to automatically track user behavior and conversions.
Data includes:
-
- Referral source
- Frequency of visits
- Product searches
- Specific pages viewed
What it tells you
Trends in website engagement provide deep insights into customer interests and buying intentions.
For example, frequent visits to a product page suggest a high level of interest, while repeat searches for similar products indicate an ongoing need. Patterns such as browsing through multiple categories without making a purchase might highlight indecision or the need for more information.
This data reveals the stage of the customer journey, helping you understand where customers are likely dropping off and what factors contribute to successful conversions.
How retailers can use it
Retailers can use website behavior data to take a number of surgical actions aimed at converting the movable middle.
- Targeted re-engagement campaigns: For instance, you can create highly targeted re-engagement campaigns aimed at moving customers further down the purchase funnel. Start by identifying customers who have frequently viewed a product but haven’t made a purchase, then send personalized promotions offering incentives or extra information. Additionally, use abandoned cart reminders to prompt your customers to complete their purchases.
- Website Shopper signals: Behavioral insights can also surface valuable signals. Recommend products based on past browsing history or adjust the homepage layout to feature items of interest. This approach not only tailors the customer experience towards their preferences but also proactively drives shoppers to purchase.
Predictor 2: Purchase History
One of the strongest signals your customer provides is purchasing.
By identifying purchase behavior — what, when, where, and how — and tying this data into a robust customer file, you can better identify the needs of your movable middle cohorts and respond to the numerous signals shoppers are sending.
Where the data comes from
Purchase history data is collected from multiple points of sale, including in-store transactions, online purchases, mobile app orders, and third-party integrations. By combining these data sources, retailers can build a detailed and unified profile of each customer’s purchasing behavior across all channels.
Data includes:
- Products purchased
- Total customer spend
- Average order value
- Frequency of purchases
- Channel used
What it tells you
Purchase history provides insights into your customers’ buying behaviors, preferences, and loyalty. By analyzing this data, you can identify spending patterns, preferred product categories, and the frequency of interactions across different sales channels.
For example, if a customer buys skincare products inconsistently — but always through your mobile app — you can infer that mobile messaging is the best way to move this customer down the purchase cycle. Similarly, if a customer occasionally purchases in-store, you may use this opportunity to promote your Buy Online, Pick Up In-Store service.
How retailers can use it
Purchase history is a powerful source of insight for retail teams. This data can be used to encourage and incentivize deeper engagement with the brand.
- Personalized marketing campaigns: Use purchase history data to create a rich customer profile. If a customer has only purchased once, analyze the data to develop specific strategies and campaigns around products that lead to repeat purchases. If a customer has made several purchases, have the data predict which products or categories will continue bringing the shopper back to purchase.
- Loyalty programs: Purchase data can also inform your loyalty program messaging. If a customer in your movable middle hasn’t joined your loyalty program yet, this is a great time to encourage them. And if another customer is close to their next loyalty tier, consider spotlighting exclusive offers or early access they would receive by moving up.
Predictor 3: App Usage Insights
Nearly all Americans between 18 and 49 make purchases with their smartphones. And 65.8% of U.S. smartphone owners will use retail apps in 2024.
It’s no surprise, then, that retailers are investing in robust apps, making it easier for customers to purchase when and where they want. If your brand offers a dedicated mobile app, this is a valuable source of customer data.
Where the data comes from
App usage insights are gathered directly from a retailer’s mobile app. A wide range of tools — including Firebase Analytics, Amplitude, Mixpanel, and more — help app owners capture and assess their mobile data.
Additionally, user permissions for tracking can provide location data and device-specific information that further enriches your understanding of customer behavior and can be used to improve your CX.
Data includes:
- Duration of app sessions
- Specific features used
- Pages viewed
- Products searched for
- Items added to the cart
- In-app purchases made
What it tells you
For starters, simply having a retailer’s app installed can indicate brand affinity and the ability to engage customers directly. App downloads and usage also signal the customer’s preferred UX — if they’re frequently using the app, it’s likely a more convenient shopping experience.
Further, app usage provides insights into customer preferences, engagement levels, and potential loyalty. For example, frequent engagement with app features, such as personalized product recommendations or loyalty program interfaces, indicates interest and satisfaction. Repeated interactions with specific product categories or frequent use of search functions can signal a customer’s ongoing needs.
How retailers can use it
Retailers can employ app usage insights to create personalized and timely marketing strategies to convert the movable middle.
- Downloads. App usage data can, first and foremost, be used to identify customers who are not using your app. With this data in hand, you can encourage this segment to download the app. Customers who shop via multiple channels tend to have compounding value for many retailers.
- Channel preferences: Does your customer prefer to shop on their mobile device while waiting in line to pick up their kids? Or do they prefer a widescreen experience from the comfort of their home? App usage data can tell you. From there, you can tailor your communication to meet their preferences.
- Customized experience: Additionally, insights into app-based behaviors allow you to customize in-app experiences. For example, you can highlight relevant products on the home screen or offer personalized deals during high-engagement periods.
Predictor 4: RFM Model Scoring
RFM (Recency, Frequency, Monetary) model scoring is a classic method to evaluate and segment customers based on their purchasing and shopping behaviors.
By analyzing how recently customers interacted with your brand, you can predict future purchasing potential and better identify the movable middle.
Where the data comes from
RFM model scoring uses two primary sources of information. First, historical transaction records are incorporated into the model to show past purchasing behavior. Second, critical customer engagement data is added to the file, providing a deeper level of insight into customer behaviors over time.
Effective RFM models cover an expansive range of data, including:
- Purchase history
- Frequency of purchases
- Website and app engagement
- Social media interactions
- Loyalty program metrics
What it tells you
RFM modeling produces a score. This score, based on recency, frequency, and monetary value metrics, can be used as an indicator of a customer’s future purchasing potential.
How retailers can use it
With RFM model scoring, retailers can better understand their customers, leading to more personalized and effective marketing strategies.
- Segmentation: Segmenting the customer base according to RFM scores equips you to tailor marketing strategies based on data-backed behavior. Once segmented, you can test retargeting and re-engagement campaigns, churn prevention strategies, and dynamic pricing tailored for each group.
- Optimize marketing spend and inventory: RFM modeling also equips you with valuable insights that can be used to effectively invest marketing and inventory dollars. By identifying the movable middle, along with your VIP customers, you can effectively reach high-ROI customers and stock the products they care about most.
Predictor 5: Predictive Lifetime Value Scoring
Predictive lifetime value scoring (PCLV) is produced by machine learning models that analyze aggregated customer profile information, including both on- and offline data.
These models aim to answer an all-important question: What is this customer worth over the lifetime of their engagement with our brand?
Where the data comes from
To anticipate lifetime value, PCLV models push beyond simplified customer lifetime value calculations — typically “customer value” times “customer lifespan.” PCLV models, such as Bluecore’s proprietary algorithm, consider many more factors.
Critically, PCLV models provide a data-driven measure of each customer’s propensity to purchase based on their complete purchasing history and engagement patterns. By factoring in behaviors like website engagement and creating a more robust customer file with shopper identification, these models offer a more accurate prediction of customer value.
What it tells you
Like RFM model scoring, PCLV outputs provide you with metrics to assess and segment your full customer file. Identify which customers are likely to generate the most revenue over time, including your movable middle.
How retailers can use it
Deploy PCLV the same way you would RFM model scoring — for segmentation, targeted messaging, and optimized marketing and inventory spend. The key benefit here is that the PCLV model focuses on value, not just purchase frequency.
For more advanced applications, use your high-value segment data as a seed for lookalike audiences on paid channels (Google, Facebook etc.) to discover new shoppers with significant ROI potential.
Bonus Tip: Test for Maximum Impact
Moving your middle is an ongoing process, not a one-and-done solution. As such, an effective way to start is by testing your marketing messages on a smaller scale before rolling them out to a broader audience.
Holdout testing is a valuable method for understanding the true impact of your marketing campaigns. Unlike A/B testing, which compares different variations simultaneously, holdout testing involves withholding a portion of your audience from receiving the campaign. This control group helps you measure the campaign’s effectiveness by comparing the behavior and engagement of those who received the campaign versus those who did not.
Take these steps to execute strong holdout testing:
- Define the test and control groups: Randomly assign a portion of your audience to the control group (holdout) and the rest to the test group.
- Run the campaign: Implement your marketing strategy with the test group while excluding the control group.
- Measure results: Analyze the differences in engagement, conversion rates, and revenue between the two groups to determine the campaign’s effectiveness.
- Optimize and iterate: Use the insights gained to refine your marketing tactics, ensuring that future campaigns are more impactful.
By incorporating holdout testing, you can make more informed decisions, ensuring your marketing efforts drive significant and measurable improvements in customer engagement and sales.
Ready to unlock your movable middle?
Start with Bluecore’s Customer Movement Assessment. Our retail strategy team conducts an in-depth assessment of your customer file, identifying your underserved, high-value segments. From there, we provide surgical recommendations based on our index of 200+ retailers to help you capitalize on growth opportunities.
Request a Customer Movement Assessment.