


The Big Picture From Billions of Data Points: Highlights from our 2024 Black Friday Benchmarks
How did Black Friday go? Not just for you, but for your peers and competitors? We’ve crunched the numbers — billions of them — to illuminate the trends driving shopper behavior at this all-important time of year.
Read one for highlights from our 2024 Black Friday Benchmarks Report.
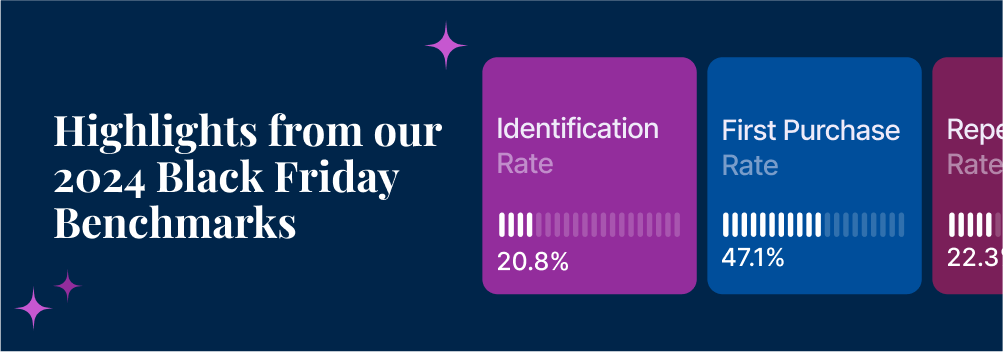
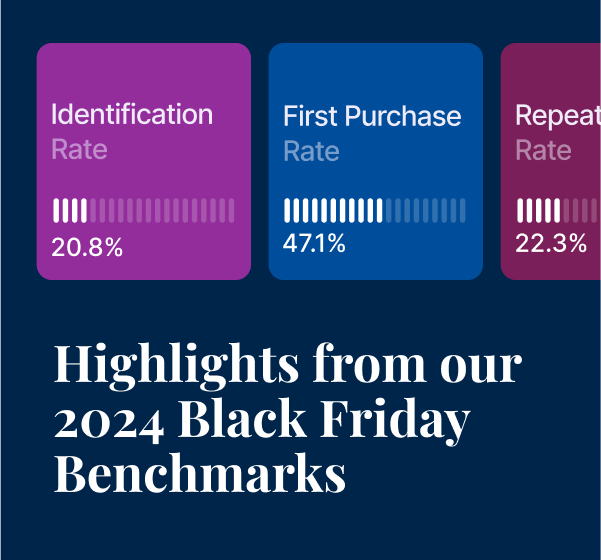
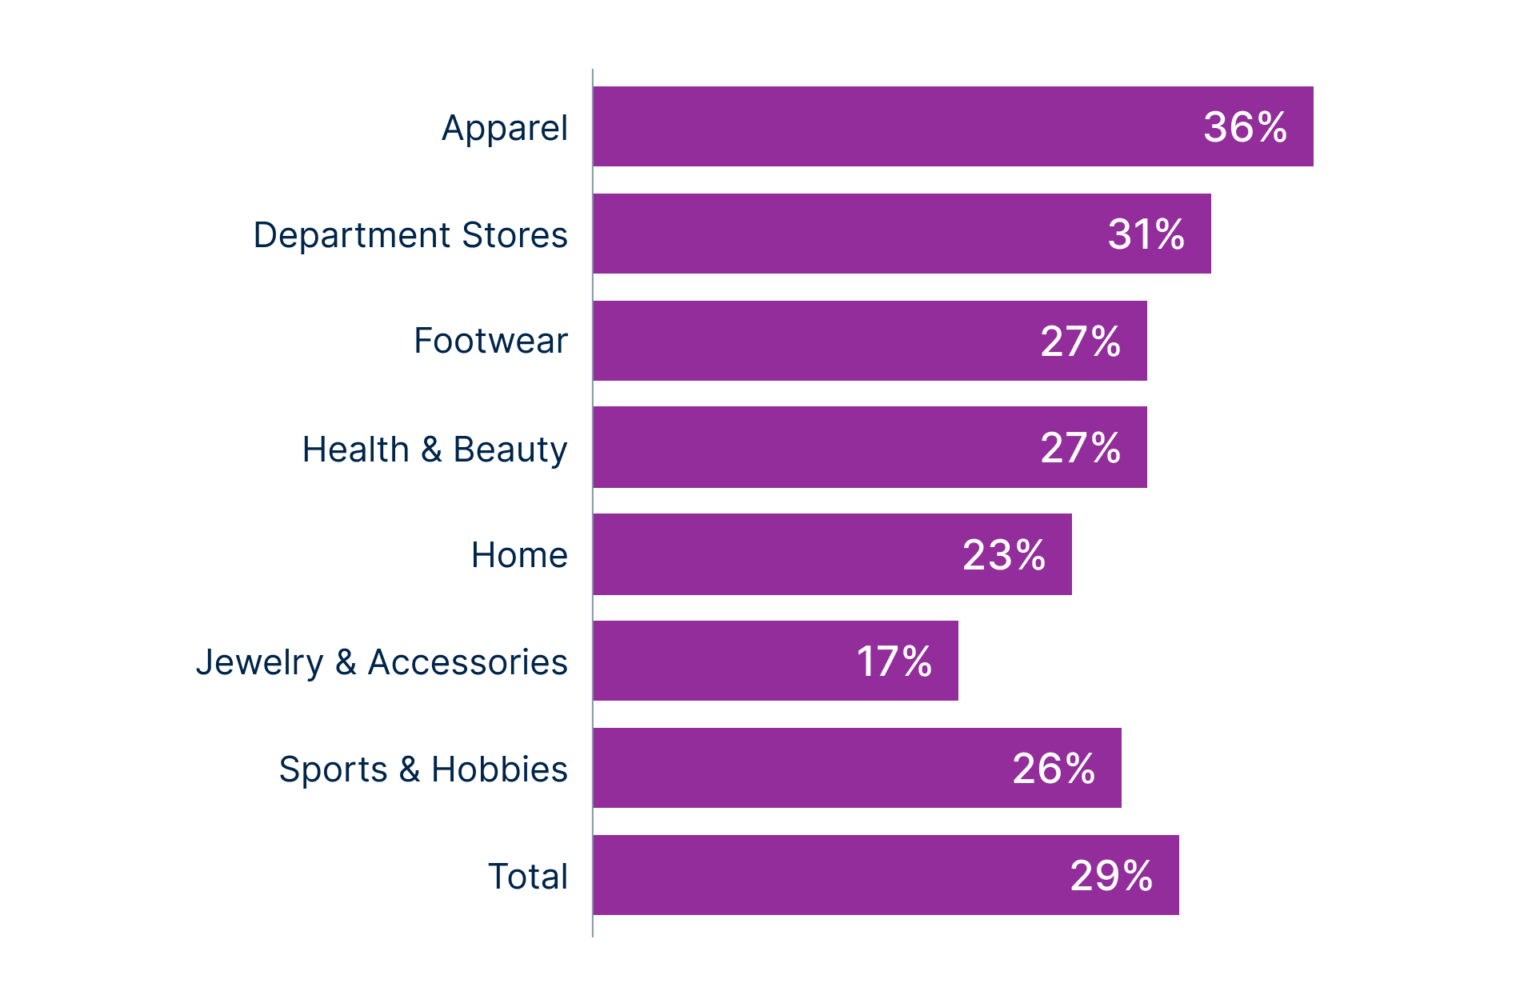
Identification rates were higher across every vertical
Apparel retailers led the pack, with an average identification rate of 36%. Across every vertical, retailers identified 29% of their shoppers, up from 21% last year. There’s still a massive opportunity for improvement.
The ability to identify shoppers is even more important during the rush, because so many holiday shoppers are gift givers with the potential to turn into one-and-dones. Identification helps you send the most relevant messages to these shoppers when they do return, maximizing your chances of converting them into repeat buyers.
Site traffic and order volumes were both down
Compared with Black Friday 2023, site traffic decreased by 6.2% and order volume, 2.7%. While that might sound ominous, remember that retailers have been trying to kick off holiday shopping earlier in the calendar year, shipping and promoting holiday buys back in October. Some of the activity we’d normally anticipate on Black Friday was finished before we even picked out our Halloween costumes.
However, luxury brands — a combination of department stores, and footwear and jewelry & accessories retailers — outperformed their general market counterparts in both areas. Inflation fears and economic jitters didn’t seem to dent shopping in this sector, with sessions up 7.7% and order volume up 5%.
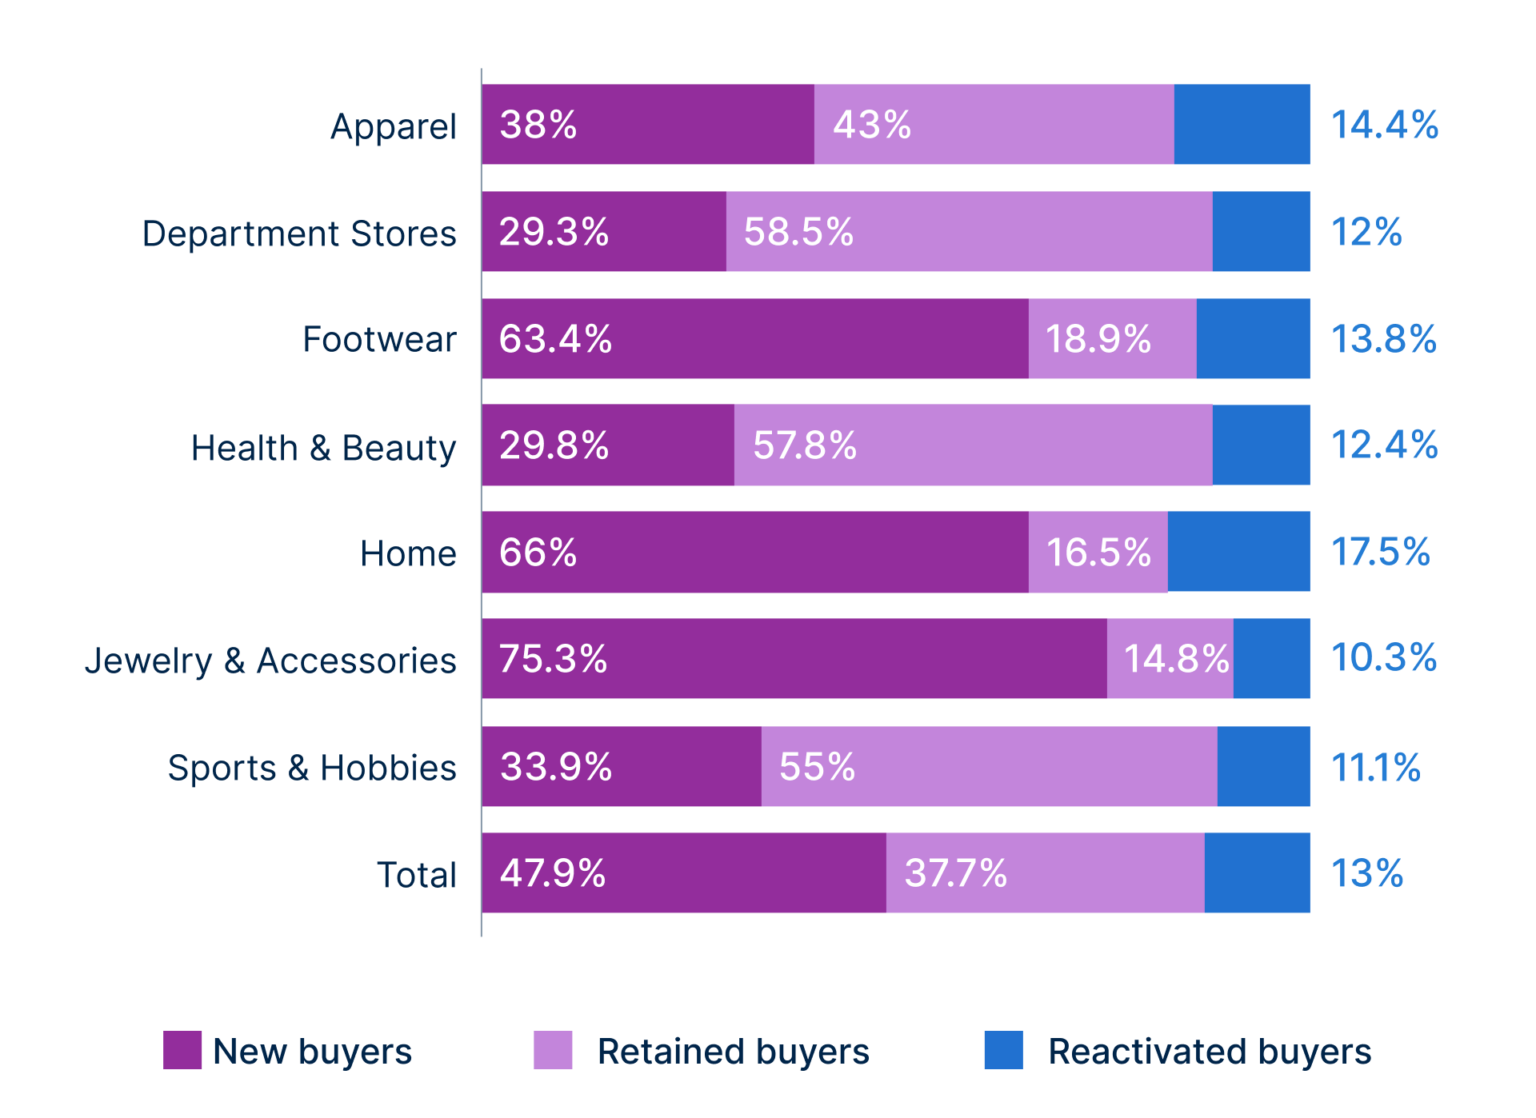
Retained customers power the holidays
As it becomes more expensive to acquire new customers, retailers are leaning into the customers they already have – with some impressive success. Repeat purchase rates were up 2.3% year-over-year.
During the entire 2023 calendar year, the average retailer reactivated 6.6% of their lapsed buyers. On Black Friday, 13% of purchases were made by reactivated customers. While counting orders is not exactly the same as counting shoppers, given the difficulty of reactivating a customer, this still shows big progress.
An additional 23.5% of orders came from active retained customers, while new buyers accounted for 63.5%.
A split in strategy
A few verticals bucked the larger trend with increased order volume: footwear and jewelry & accessories retailers as well as department stores. Meanwhile, apparel, health & beauty, and sports & hobbies retailers saw lower sessions and lower order volume. But as we’ll see, that’s not necessarily a bad thing.
Jewelry & accessories and department stores
Department stores and jewelry & accessories retailers appeared to be spending and discounting to drive traffic. Jewelry & accessories brands even had a 20% spike in orders — by far the largest year-over-year increase of any vertical.
Those sales largely came from new customers: 75% for enterprise retailers and 83% for mid-market. That’s a little dangerous because these brands also had the worst identification rates.
Department stores also spent heavily, but they’re spending on a different type of buyer: retained customers. Their percentage of new buyers was the lowest of any vertical. With a strong percentage of sales from retained buyers, you can be more confident that these are shoppers who will keep buying from you.
Apparel, health & beauty, and sports & hobbies
These verticals made a somewhat different play. All three seemed not to spend as much on acquisition or discount too heavily. This resulted in year-over-year decreases in site traffic and order volume.
Their average order values were up, however. Health & beauty retailers, in particular, saw average order values almost 10% higher than last year.
These categories are also leaning more heavily into retained buyers, relying on the health of their customer base. This was particularly true for enterprise brands. For all four verticals, new buyers accounted for less than 40% of Black Friday purchases.
For a deeper dive into our latest holiday intel, read the full report here.