


Data Insights: Black Friday Cyber Monday 2021
Bluecore collected data on Black Friday Cyber Monday 2021 to identify insights in shopper behavior. These insights offer retailers visibility into the trends that will not only impact sales for the remainder of the year and going into 2022, but also demonstrate fundamental changes for consumers.
Bluecore derived data on Black Friday and Cyber Monday from 787 million first-party cookies, 585 million cart events, 4 million unique products, 39.2 million orders and $4.7 billion in total sales across 153 retail brands (47 Apparel, 19 Health & Beauty, 21 Footwear, 15 Home Goods, 11 Jewelry, 11 Specialty Gifting, 22 Sporting Goods, and 7 Technology).
The resulting insights are based on analysis of a total of 5.9 billion shopper events across these brands’ ecommerce sites.
Bluecore gathered and analyzed this data on Black Friday 2021 and Cyber Monday 2021. The complete methodology can be found in the Appendix of this report.

Question 1: Did retail brands see more repeat purchases on Black Friday 2021? Or are most customers first-time buyers?
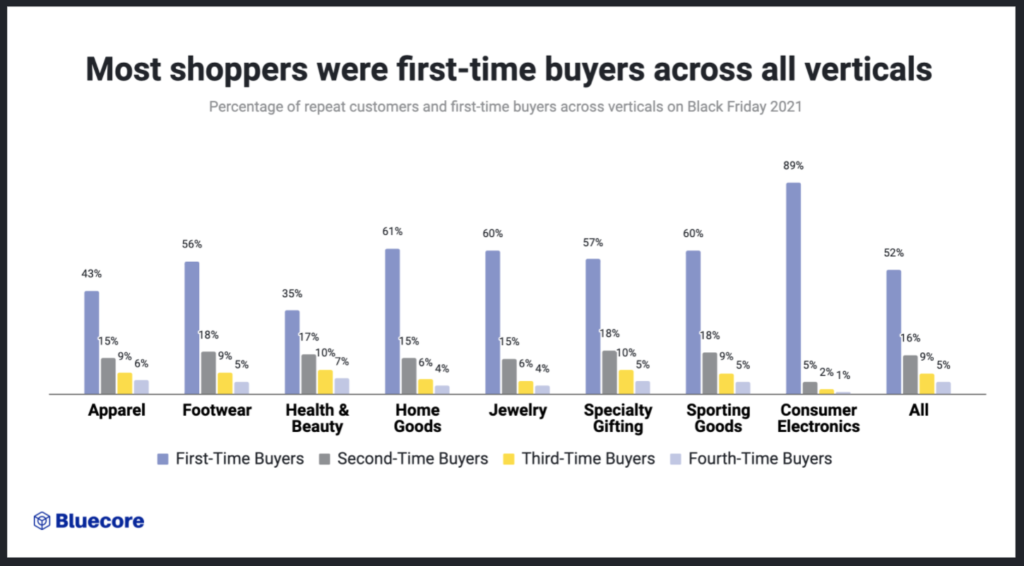
- Across verticals, shoppers were trying new brands for the first time — this is a typical trend for the holidays as shoppers are trying new brands with all of the discounts.
- Consumer Electronics saw the highest percent of first-time buyers (89%) and lowest percentage of second, third and fourth-time buyers (5%, 2%, 1% respectively), which could indicate that many shoppers are drawn in by compelling deals for high ticket items such as TVs and don’t typically return to shop again.
- The percentage of second, third and fourth-time buyers were similar across the remaining verticals.
Why is this important? These new shoppers represent a huge opportunity for brands to drive repeat purchases and increase customer lifetime value and revenue for brands. Bringing your first-time shoppers from Black Friday back to your brand could mean an $898K revenue opportunity for every 100,000 shoppers and each next purchase increases customer lifetime value for retailers across industries from apparel to home goods.
Question 2: Did brands see more first and second-time buyers on Black Friday 2021 compared to Black Friday 2020?
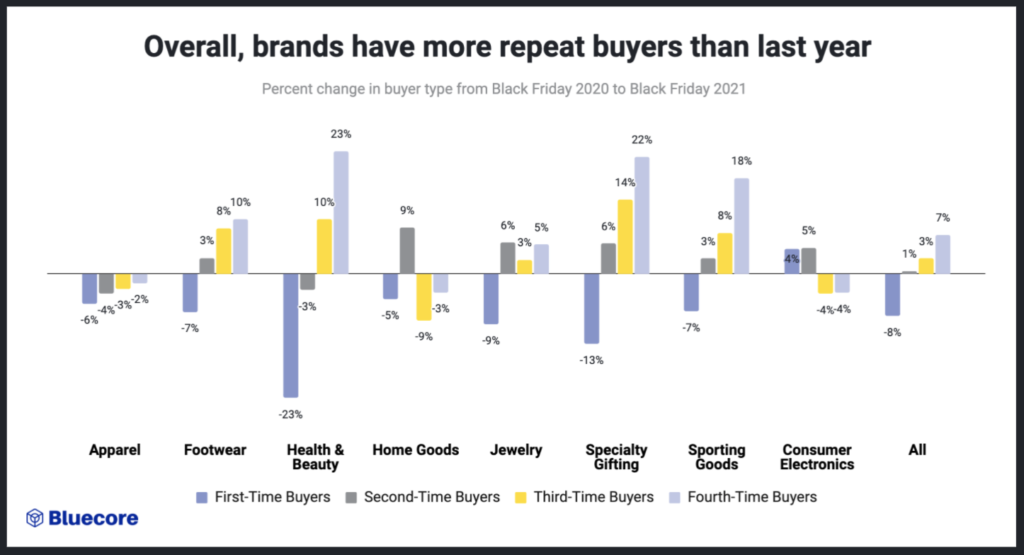
- Overall increases in second, third and fourth-time buyers could be a result of the spike in discovery in 2020, which led shoppers to return to the brands that offered good experiences.
- Health & Beauty and Specialty Gifting have the greatest increases in third and fourth-time buyers which could indicate that they have strong post-purchase nurture streams or strong replenishment programs for Healthy & Beauty specifically.
- The 23% decrease in first-time buyers for Health & Beauty in 2021 could be attributed to a year of discovery in 2020, especially considering the 2020 trend for at-home self-care. This is now normalizing. However many shoppers came back for a third and fourth purchase, which could indicate a desire to remain with the brands they discovered in 2020.
- The increase in second, third and fourth-time buyers for Specialty Gifting (6%, 14%, 22% respectively) could represent that these are go-to brands for specific gifts every year.
Question 3: How many shoppers became repeat buyers of brands they first discovered this year?
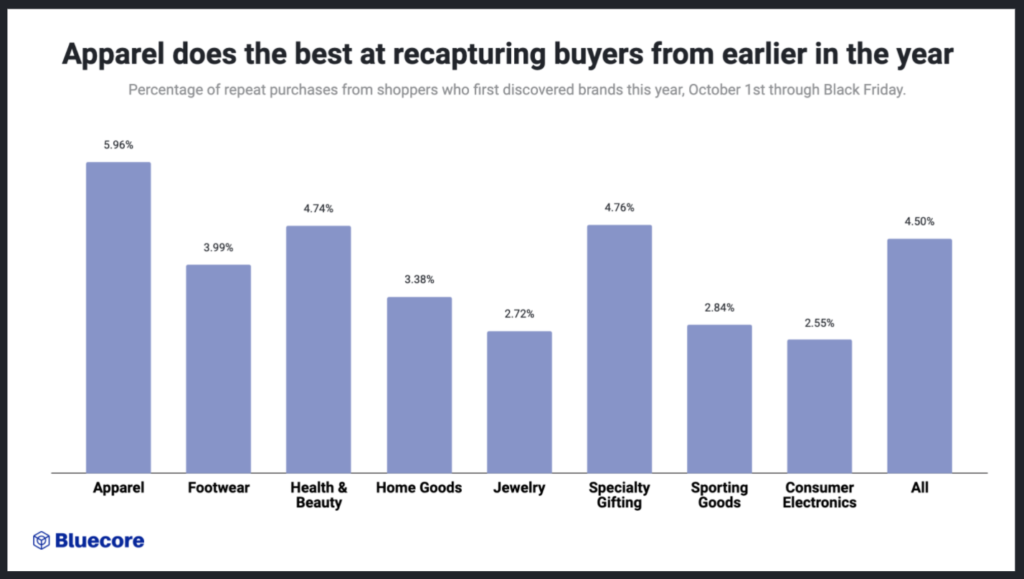
- Apparel saw the quickest repeat buyers with nearly 6% of people who purchased with them in October 2021 or after, buying again on Black Friday. This could be a result of immediate and continuous nurturing campaigns by Apparel brands.
- Brands across verticals only recaptured 4.5% of shoppers who first discovered them in October 2021 or after, indicating that Black Friday marketing is still focused primarily on acquisition over retention.
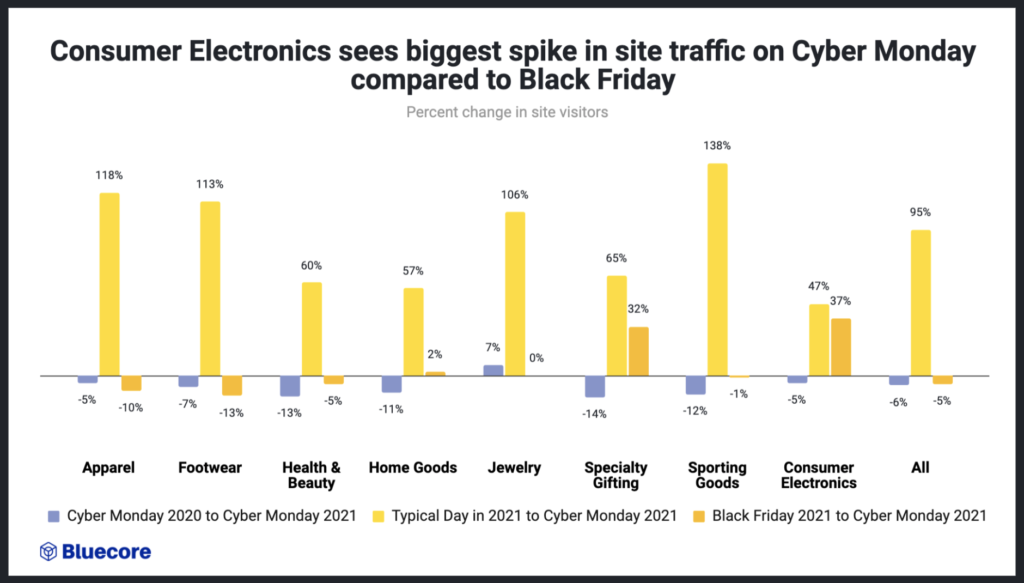
Question 4: How does site traffic on Black Friday 2021 compare to Black Friday 2o20? How does it compare to Cyber Monday 2021?
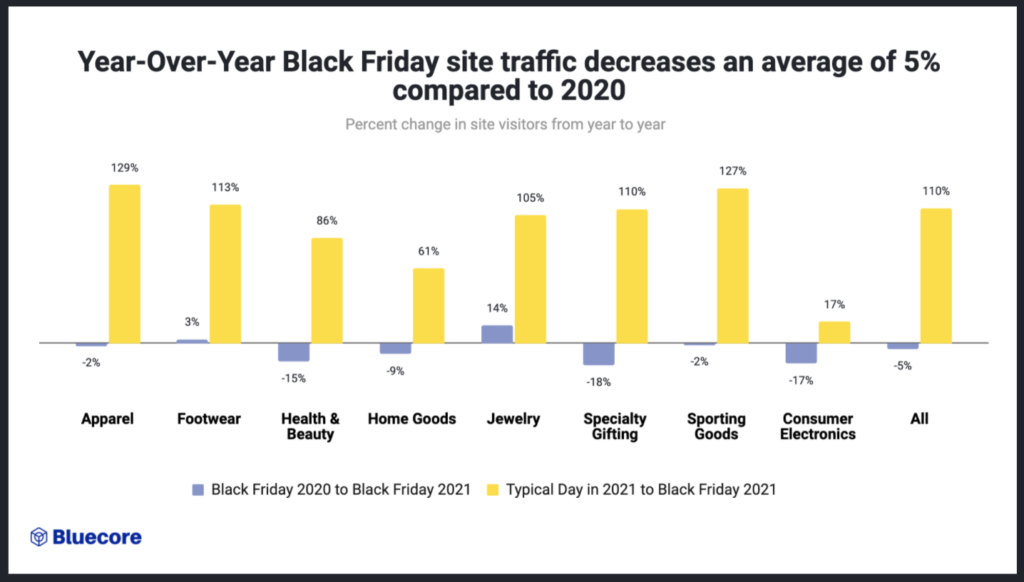
- Black Friday site traffic decreased by 5% compared to Black Friday 2020
- 2021 Black Friday site traffic is on average 110% higher than on a typical day across verticals.
- With the exception of Footwear and Jewelry, there is a slight decline in online site traffic across most verticals compared to last year, indicating that shoppers may have opted for in-store shopping since stores reopened.
- The 14% increase in Jewelry could represent shoppers who have considered a purchase for a while and waited until Black Friday to capture a deal.
- Apparel saw the highest increase in site traffic (129%) compared to a typical day, which could indicate shoppers looking for deals to refresh their wardrobe with more opportunities to meet in person.

- Overall, brands saw 5% less site traffic on Cyber Monday compared to Black Friday in 2021
- Site traffic increased for Home Goods, Consumer Electronics and Specialty Gifting from Black Friday to Cyber Monday
- Shoppers looking for big-ticket items could be waiting for a better deal before they convert on the last day of the holiday weekend
Question 5: Are Black Friday purchases more likely to be planned or impulse buys?
- The majority of purchases on Black Friday 2021 were impulse buys (58%).
- Most verticals saw similar thresholds of window shopping ahead of making a purchase, as they did in 2020, indicating that many purchases continue to be planned.
- The decrease in window shopping in Sporting Goods (43% to 30%) could also indicate that shoppers decided to both window shop and buy the products in-store.
Why is this important? This spread of impulse vs. planned buys indicates that brands must have a marketing plan that accounts for both impulse and planned buys to capture the maximum number of purchases.
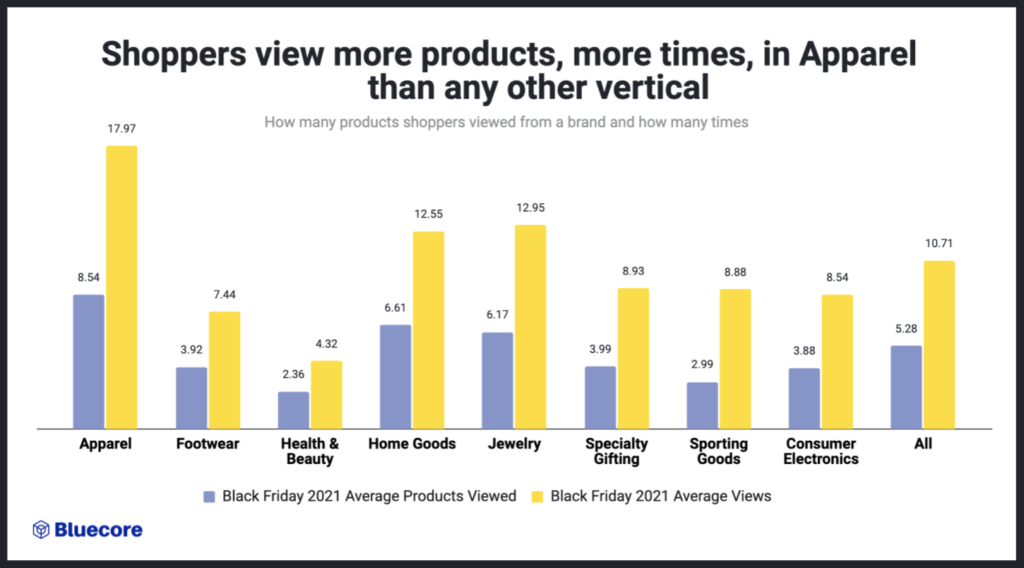
- Shoppers viewed the most products the most times when shopping for Apparel (8.54 products, 17.97 times), which could indicate shoppers window shopping and browsing without a specific product in mind.
- Health & Beauty, Sporting Goods and Consumer Electronics saw the lowest number of products viewed, which could indicate that shoppers had a specific product in mind.
Question 6: Did shoppers place more orders on Black Friday 2021 compared to Black Friday 2020? Did they place more orders on Cyber Monday 2021 compared to Black Friday 2021?
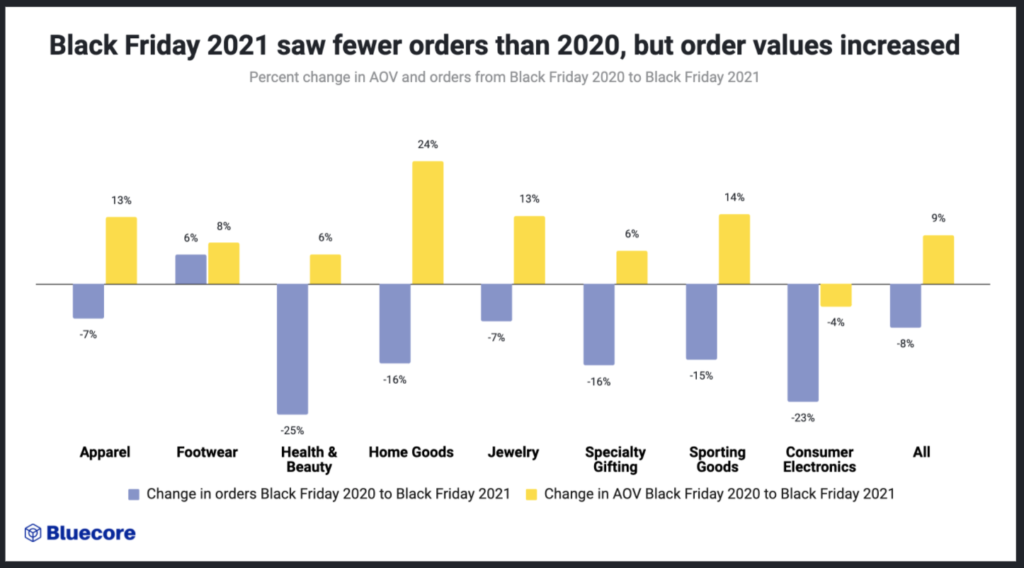
- The overall decrease in orders (8%) but increase in average order values (9%) could be attributed to brands’ ability to better recommend and bundle products to each shopper ahead of their purchase, for example through on-site recommendations, exit intent pop-ups or abandoned cart emails. It could also be attributed to overall price inflation.
- The rise in AOV despite the drop in orders could also be a result of 17% of brands offering less discounts this year to protect their margins during the global supply shortage
- Footwear saw an increase in both number of orders (6%) and average order values (8%), which could indicate shoppers’ desire to refresh their shoe repertoire with more opportunities to meet in person.
- Technology saw a decrease in both orders (23%) and average order values (4%), which could be attributed to inventory issues related to the shortage of microchips.
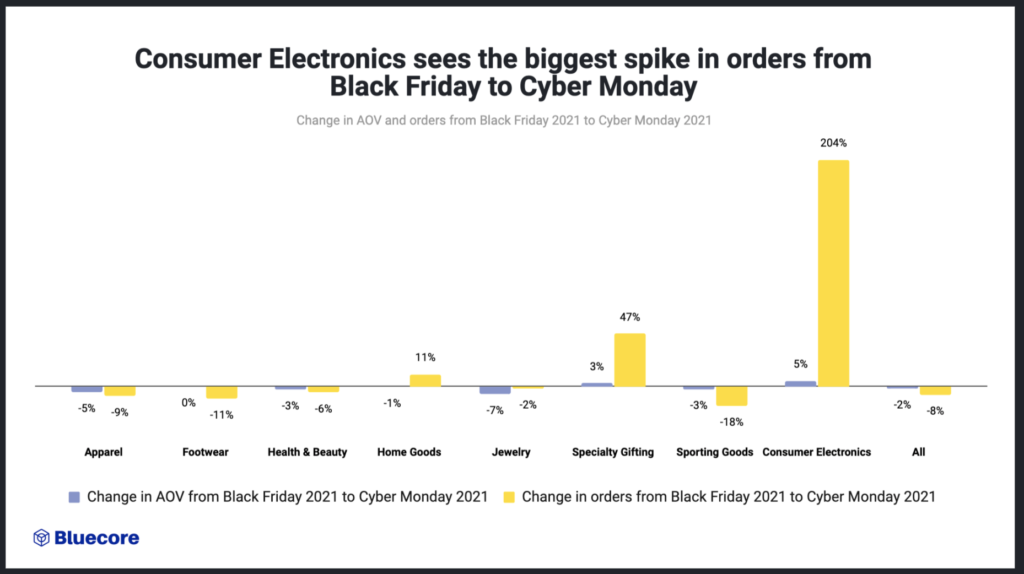
- Overall, brands saw 8% less orders on Cyber Monday compared to Black Friday in 2021.
- Consumer electronics orders rose 204% from Black Friday 2021, which could indicate shoppers’ holding out for bigger deals.
- Specialty Gifting and Home Goods also saw more orders on Cyber Monday, indicating for Home Goods that shoppers may be holding out on purchasing big ticket items like furniture.
Question 7: How many shoppers abandoned a brand because the product they wanted was out of stock on Black Friday Cyber Monday 2021?
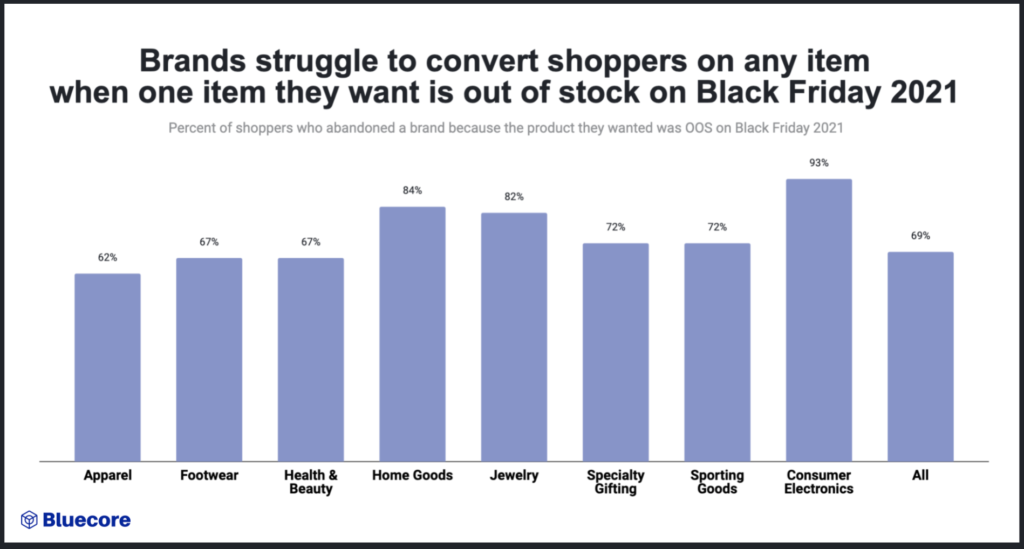
- A high majority of shoppers (69% on Black Friday and 74% on Cyber Monday) abandoned a brand — instead of purchasing another product — if a product they wanted was out of stock. This indicates brands’ inability to foster in-the-moment discovery and recommendations of new products that are in-stock.
- Apparel was the most successful at salvaging shoppers when items were out of stock, with 38% on Black Friday converting to another product, but still lost 62% of shoppers who came looking for a specific item.
- Consumer Electronics was the least successful at salvaging shoppers when items were out of stock with only 7% purchasing another product on Black Friday.
Question 8: What verticals were impacted by the global supply shortage?
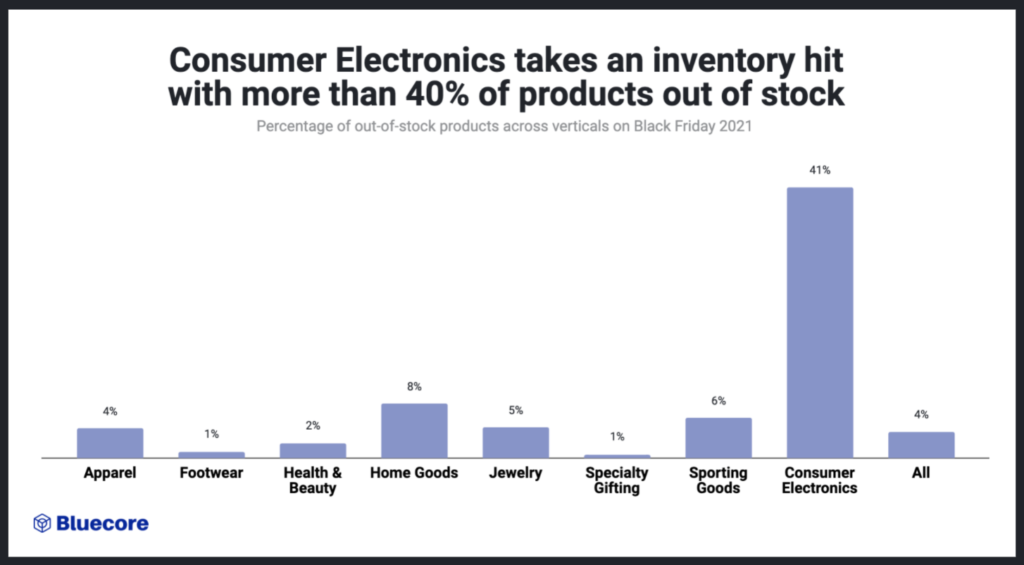
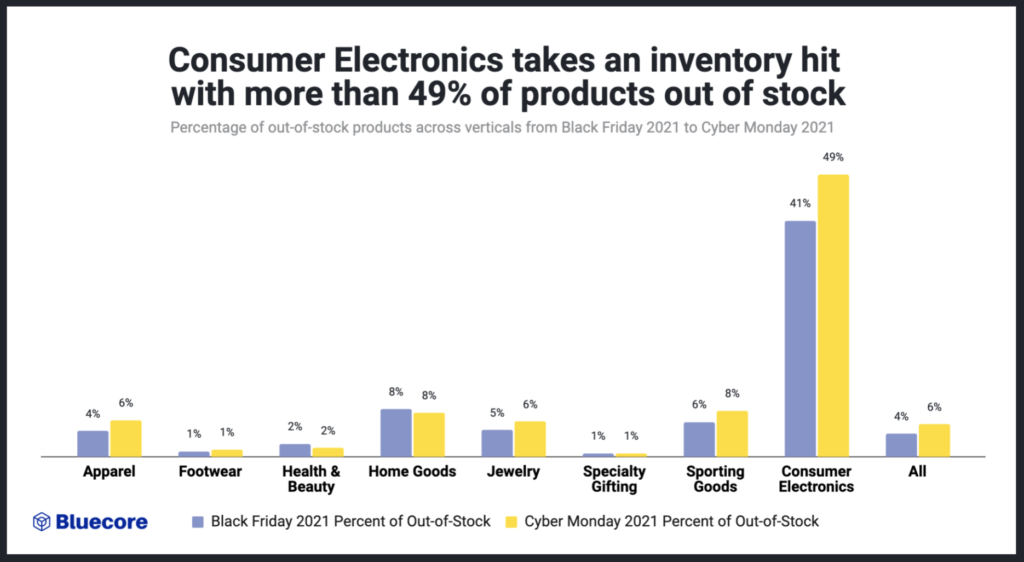
- All brands saw an increase in OOS items from Black Friday to Cyber Monday.
- Consumer Electronics had the highest percentage of out-of-stock products (41% on Black Friday and 49% on Cyber Monday). This is 33% more than the second-most affected vertical, Home Goods, which had 8% of products out-of-stock.
- The huge spike in out-of-stock products in Consumer Electronics is likely due to the shortage of raw materials and microchips, and the fact that most technology products are produced in Asia, which is still experiencing issues with COVID that are impacting labor.
- Footwear and Speciality Gifting were least affected, which could indicate that they had more influence over their supply chain.
- All other verticals experienced relatively similar out-of-stock thresholds.
Question 9: What Apparel products were most sought out during Black Friday 2021? Compared to Black Friday 2020?
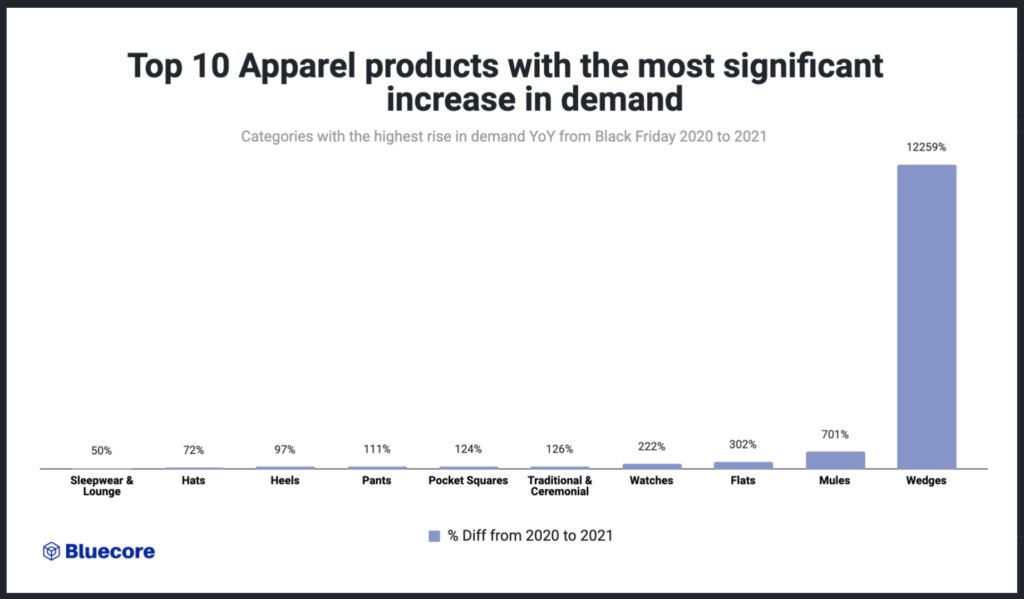
- Wedges, Mules, and Flats — all in the shoe category — have the highest rise in demand since 2020. This unseasonal demand for warm-weather styles is likely attributed to steep discounts as well as an increase in winter vacations to warm destinations.
- Pocket Squares and Traditional and Ceremonial clothing were much more popular in 2021 compared to 2020, which could be attributed to the rescheduling of pandemic weddings and large events causing a rise in formalwear.
Question 10: What Apparel products were least sought out during Black Friday 2021 compared to Black Friday 2020?
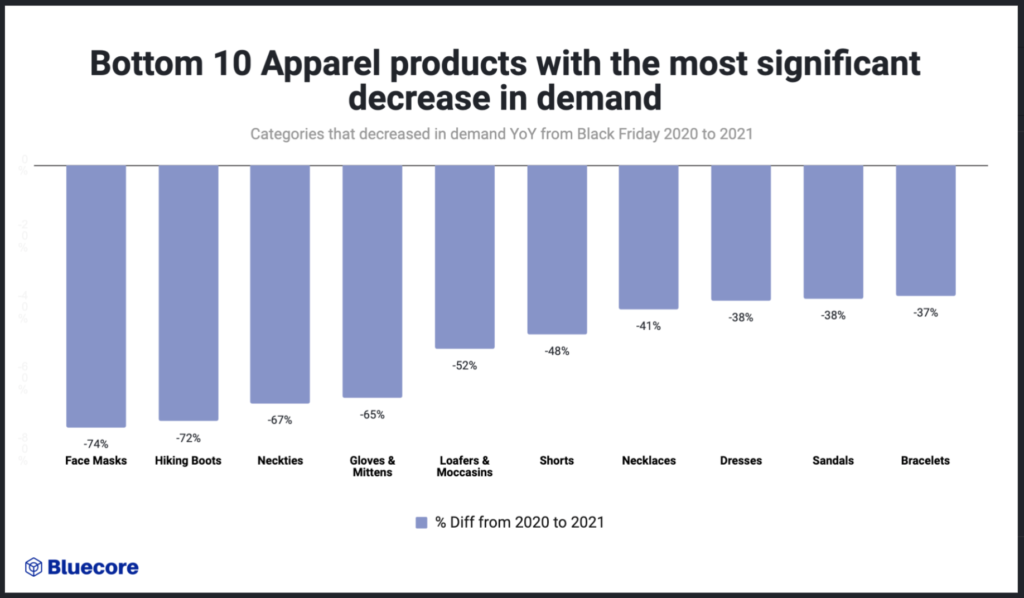
- Face masks are seeing the most significant decrease at 74%, which indicates less of a need for face masks given the rise in vaccination rates.
- Hiking boots are seeing the second most significant decrease at 72%, which could be due to shoppers having already purchased these products last year at the height of the pandemic when social distancing activities were on the rise.
- Decreased demand for neckties and dresses (67% and 38% respectively) is likely due to most professionals still being on Zoom with less of a need for business attire.
Question 11: Did average order values increase across First-Time, Second-Time, Third-Time and Fourth Time Buyers on Black Friday 2021?
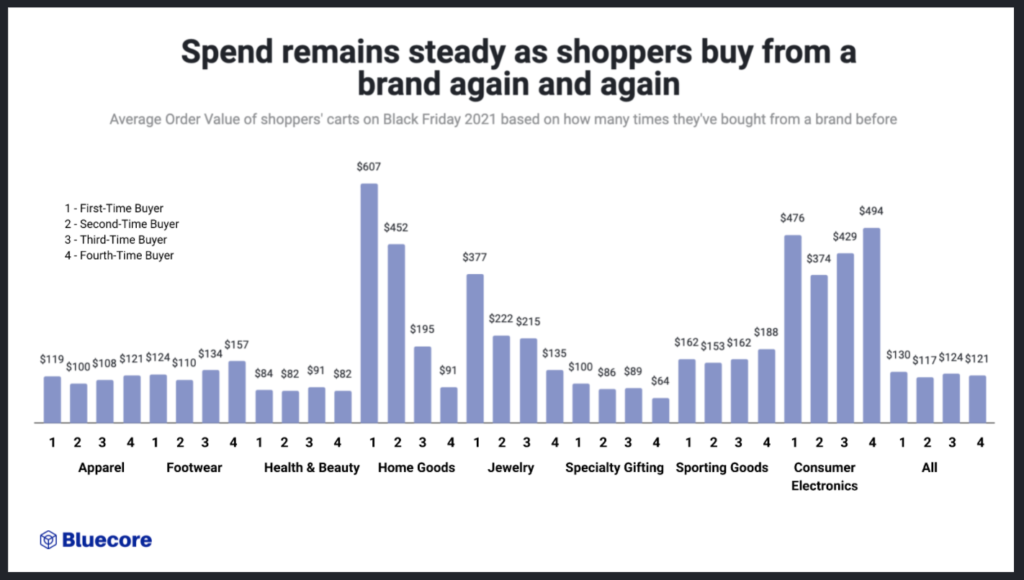
- Buyer value does not increase or decrease with subsequent purchases — as shoppers buy again and again, their average order values remain steady
- Home Goods and Jewelry see the most significant decreases in average order values over time, which could indicate that the highest-value items are typically made in the first purchase
Why is this important? These numbers confirm previous data from Bluecore that the value of an individual shopper that makes multiple purchases over time, compounds. This leads to exponential profitability with each subsequent purchase. Given the rising costs of new customer acquisition in comparison to the relatively lower cost of driving each additional purchase, retailers should be investing heavily in retention as a growth strategy.
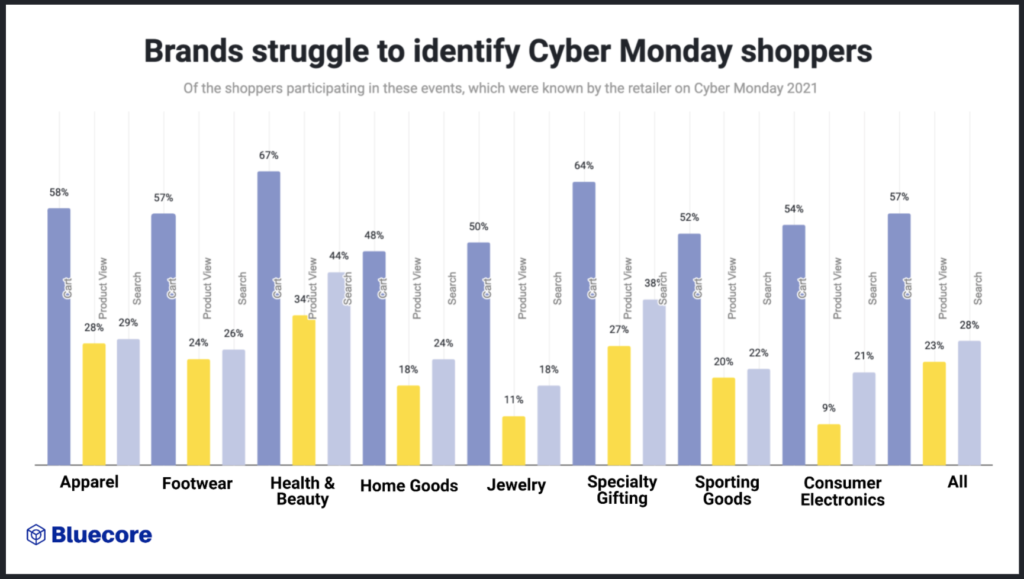
Question 12: What percentage of shoppers were identified by brands on Black Friday Cyber Monday 2021?
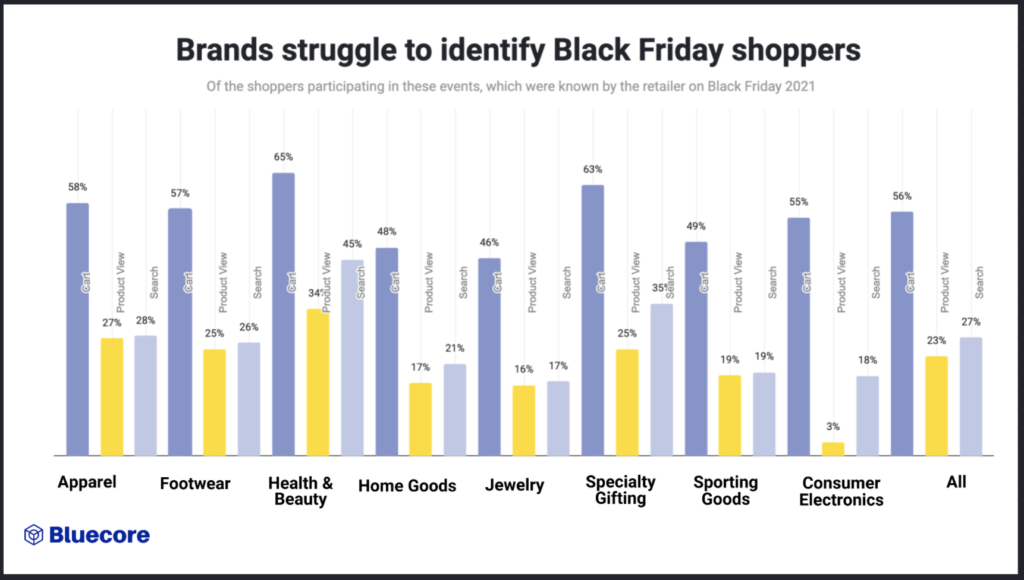
- Of all shoppers who interacted with a brand’s site through adding to a cart, searching for a product or viewing a product, 43% for cart, 77% for view, 72% for search were not known for a brand.
- Since cart events indicate a greater intent to buy, the likelihood of identifying a shopper is higher
- Health & Beauty identify the greatest percentage of shoppers adding to cart and viewing products on Black Friday 2021 (65% and 34%) and Cyber Monday 2021 (67% and 34%).
- Home Goods and Consumer Electronics see the lowest percentage of identified shoppers, which could point to the occasional nature of shopping in these categories which leave less of an opportunity for shoppers to identify themselves.
Why is this important? Identifying a shopper is the critical first step in being able to communicate with shoppers effectively. Identification opens the door to understanding their unique behavior and preferences in order to be able to deliver personalized, automated recommendations that help shoppers navigate the variety of products on your site with as few clicks as possible and ultimately get them to their first purchase. Improved identification leads to more conversion opportunities that drive ecommerce revenue.
Question 13: How many orders were placed from November 23rd through November 28th relative to Cyber Monday?
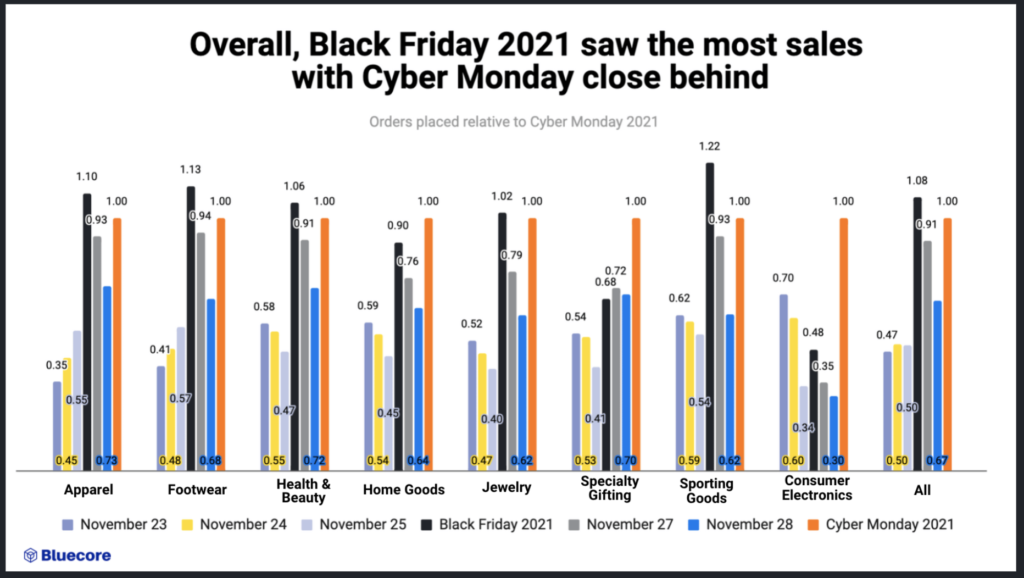
- Overall, brands saw 8% more sales on Black Friday 2021 over Cyber Monday 2021
- Home Goods, Specialty Gifting and Consumer Electronics saw the most orders on Cyber Monday 2021
- The Saturday after Black Friday saw a steady sales across all categories
Appendix:
Methodology: Black Friday 2021
Bluecore derived this data from 348 million first-party cookies, 502 million cart events, 3 million unique products, 33 million orders and $4 billion in total sales across 153 retail brands (47 Apparel, 19 Health & Beauty, 21 Footwear, 15 Home Goods, 11 Jewelry, 11 Specialty Gifting, 22 Sporting Goods, and 7 Technology).
These insights are derived from Black Friday UTC (7PM EST Thursday 11/26 – 7PM EST Friday 11/27).
Q1: Did retail brands see more repeat purchases on Black Friday 2021? Or are most customers first-time buyers?
For 153 retail brands (47 Apparel, 19 Health & Beauty, 21 Footwear, 15 Home Goods, 11 Jewelry, 11 Specialty Gifting, 22 Sporting Goods, and 7 Technology), we calculated the percentage of first-time, second-time, third-time, and fourth-time buyers on Black Friday 2021.
Q2: Did brands see more first and second-time buyers on Black Friday 2021 compared to Black Friday 2020? What did this look like on Cyber Monday?
For 153 retail brands (47 Apparel, 19 Health & Beauty, 21 Footwear, 15 Home Goods, 11 Jewelry, 11 Specialty Gifting, 22 Sporting Goods, and 7 Technology), we calculated the percentage of first-time and second-time buyers on Black Friday 2021 and compared that to the percentage of first and second-time buyers in 2020.
Q3: How many shoppers became repeat buyers of brands they first discovered this year?
For 153 retailers (47 Apparel, 19 Health & Beauty, 21 Footwear, 15 Home Goods, 11 Jewelry, 11 Specialty Gifting, 22 Sporting Goods, 7 Technology), we calculated the proportion of buyers who made their first purchase from 1/1 – 9/30 and purchased again in the early holiday season, defined as 10/1 – Black Friday (11/27)
Q4: How does site traffic on Black Friday 2021 compare to Black Friday 2020?
For 153 retailers (47 Apparel, 19 Health & Beauty, 21 Footwear, 15 Home Goods, 11 Jewelry, 11 Specialty Gifting, 22 Sporting Goods, 7 Technology) in 2021:
55 retailers have < 20,000 cookies onsite on a typical day (‘smaller’), 52 retailers have between 20K-100K cookies onsite on a typical day and 46 retailers have > 100K people on-site on a typical day in 2020. A customer is considered on-site if one of the following retail-specific actions is taken: add to cart, viewed cart, viewed product, search, browse category, or purchase. As such, homepage visits are not included. For each retailer, site traffic on Black Friday is compared to that of a typical day in October 2021 and the factor is calculated as: number of cookies on-site on Black Friday/number of cookies on-site on a typical day, October 2021.
For each category, the median factor is calculated and can be interpreted as described.
Q5. Are Black Friday purchases more likely to be planned or impulse buys?
For 153 retailers (47 Apparel, 19 Health & Beauty, 21 Footwear, 15 Home Goods, 11 Jewelry, 11 Specialty Gifting, 22 Sporting Goods, 7 Technology) in 2021, we calculated the proportion of Black Friday shoppers viewed a product within the entire month prior to the day. For each retailer calculate the following and take the median values for each category:
Average number of products viewed: average number of distinct products (as calculated using the product id field) viewed in the month prior to Black Friday.
Average number of views: average number of distinct views in the month prior to Black Friday (a single product can be viewed multiple times).
Proportion of Black Friday shoppers that viewed: the proportion of all the customers who made a purchase online on Black Friday that viewed at least once in the month prior.
Q6: Did shoppers place more orders on Black Friday 2021 compared to Black Friday 2020?
For 153 retailers (47 Apparel, 19 Health & Beauty, 21 Footwear, 15 Home Goods, 11 Jewelry, 11 Specialty Gifting, 22 Sporting Goods, 7 Technology) in 2021 we calculated proportion of Black Friday shoppers who placed an order on Black Friday 2021 and compared it to the proportion of shoppers who placed an order on Black Friday 2020, operating off of UTC time zone.
Q7. How many shoppers abandoned a brand because the product they wanted was OOS?
For 107 retailers (39 Apparel, 10 Health & Beauty, 13 Footwear, 11 Home Goods, 7 Jewelry, 9 Specialty Gifting, 13 Sporting Goods, 3 Technology) in 2021 we calculated the proportion of shoppers who viewed a product that was out of stock and then did not purchase any other product.
Q8: What verticals were impacted by OOS?
For 107 retailers (39 Apparel, 10 Health & Beauty, 13 Footwear, 11 Home Goods, 7 Jewelry, 9 Specialty Gifting, 13 Sporting Goods, 3 Technology) in 2021 we calculated the proportion of product views that involved a product that was out of stock.
Q9: What products were most sought-out during Black Friday 2021? Compared to Black Friday 2020?
For 15 retailers (All apparel) in 2021 we calculated the percentage of products in each product’s category defined by our Universal Catalog model.
Q10: What products were not popular during Black Friday 2021? Compared to Black Friday 2020?
For 15 retailers (All apparel) in 2021 we calculated the percentage of products in each product’s category defined by our Universal Catalog model.
Q11: What was the AOV of shoppers’ carts for 1st time, 2nd time, 3rd time and 4th time buyers on Black Friday?
For 153 retailers (47 Apparel, 19 Health & Beauty, 21 Footwear, 15 Home Goods, 11 Jewelry, 11 Specialty Gifting, 22 Sporting Goods, 7 Technology) in 2021 we calculated the average order value of shopper’s orders, broken down by their purchase number – 1st time, 2nd time, 3rd time, or 4th time.
Q12: What percentage of shoppers were identified by brands on Black Friday Cyber Monday 2021?
For 153 retailers (47 Apparel, 19 Health & Beauty, 21 Footwear, 15 Home Goods, 11 Jewelry, 11 Specialty Gifting, 22 Sporting Goods, 7 Technology) in 2021 we calculated the percentage of shoppers that were identified by their email address, for three different shopper event types (Viewed Product, Search, and Cart).
Q13: How many orders were placed from November 23rd through November 28th relative to Cyber Monday?
For 153 retailers (47 Apparel, 19 Health & Beauty, 21 Footwear, 15 Home Goods, 11 Jewelry, 11 Specialty Gifting, 22 Sporting Goods, 7 Technology) in 2021 we calculated the number of orders on each day relative to the number of orders placed on Cyber Monday.
Methodology: Cyber Monday 2021
These insights are derived from Cyber Monday UTC (7PM EST Sunday 11/28 – 7PM EST Monday 11/29).
Bluecore derived data on Black Friday from 439 million first-party cookies, 83 million cart events, 663 million shopper events, 1 million unique products, 6.2 million orders and $688 million in total sales across 153 retail brands (47 Apparel, 19 Health & Beauty, 21 Footwear, 15 Home Goods, 11 Jewelry, 11 Specialty Gifting, 22 Sporting Goods, and 7 Technology).
All methodology was the same for Cyber Monday questions as Black Friday questions.