


Behind the Scenes of Black Friday-Cyber Monday 2017: Tracking the Shift in Ecommerce Performance
Every retailer knows the holiday season is the single most important time of the year, and this year most retailers came out swinging.
Headlines like The Washington Post’s “Cyber Monday is shaping up to be the largest online shopping day in U.S. history” say it all. This blockbuster kickoff to the holiday season was a bright spot in a year that’s been dominated by doomsday headlines about the death of retail.
While much has already surfaced about retail performance during the week encompassing Thanksgiving, Black Friday and Cyber Monday, we decided to take a closer look at ecommerce performance in particular. To do so, we pulled performance data for a full week starting on Thanksgiving Thursday and ending on Cyber Wednesday for a select group of top apparel and footwear retailers. Here’s what we learned.
2017 Black Friday-Cyber Monday Sees an 8% Ecommerce Revenue Increase Over 2016
Starting at the highest level, we saw an 8% increase in ecommerce revenue in 2017 compared 2016.
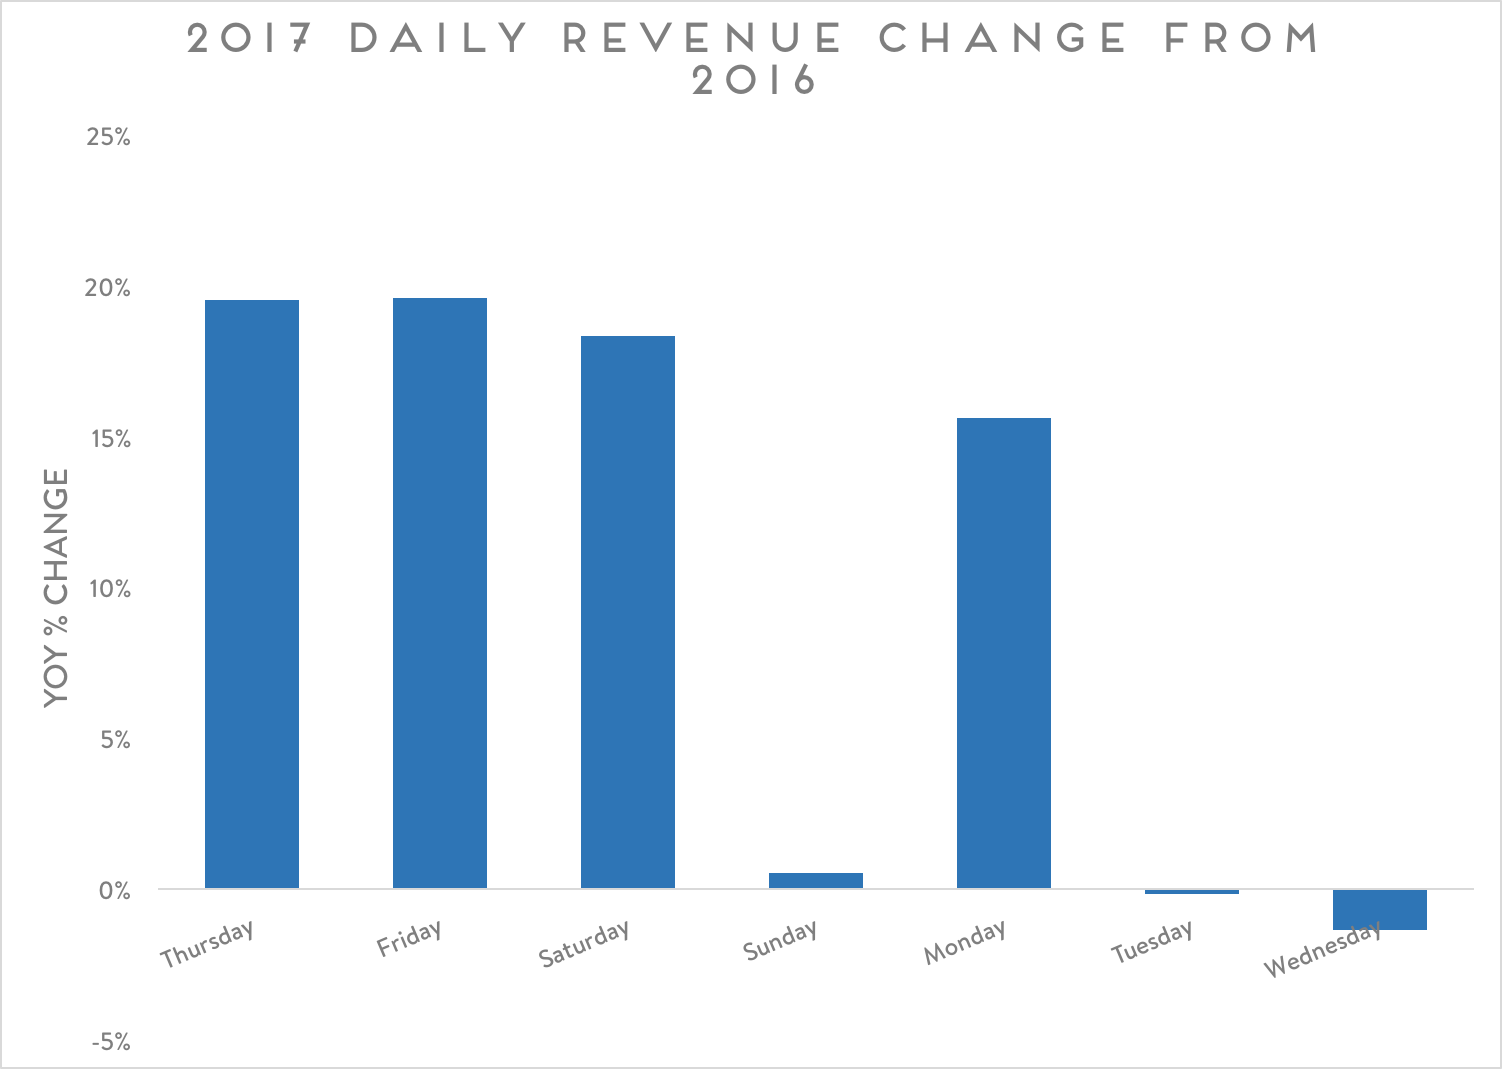
Looking day by day, this increase came largely from upticks in revenue on Thanksgiving Thursday, Black Friday, Saturday and Cyber Monday, with revenue on each of these days increasing about 20% compared to the corresponding days in 2016.
This day by day breakdown surfaces several noteworthy insights, including:
1) Ecommerce Activity is Shifting Earlier in the Week
We’ve heard a lot about Cyber Monday extending further and further into a full Cyber Week, but our data reveals that, at least in the apparel space, ecommerce revenue comes more from the beginning of the week than the end of the week. In fact, Cyber Wednesday brought in less revenue than Thanksgiving Thursday. The fact that Black Friday traffic continues to move online more and more each year and that Cyber Monday revenue dipped slightly compared to 2016 also support this shift.
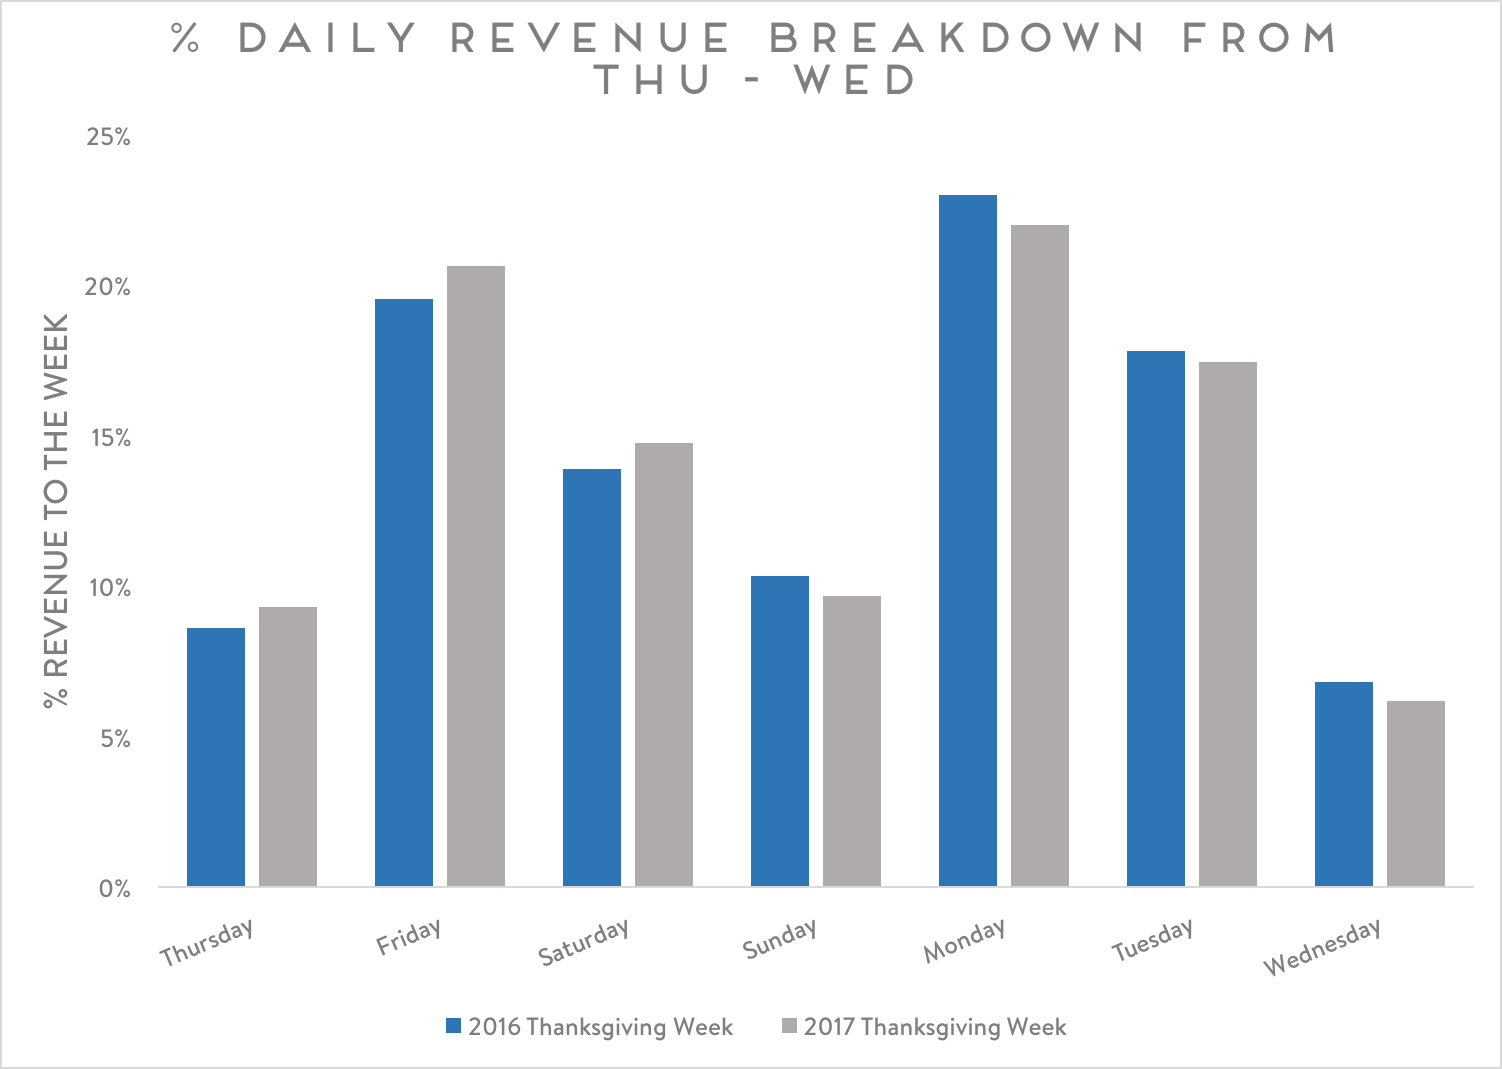
2) Cyber Monday Still Reigns King, But the Gap is Closing
Following on the shift of ecommerce activity to earlier in the week, we see that even though Cyber Monday still boasts the most ecommerce revenue for a single day, Black Friday is narrowing the gap as more shopping activity during that day moves online. Specifically, we saw a 15% difference in revenue between the two days in 2016 that narrowed to a 5% difference in 2017.
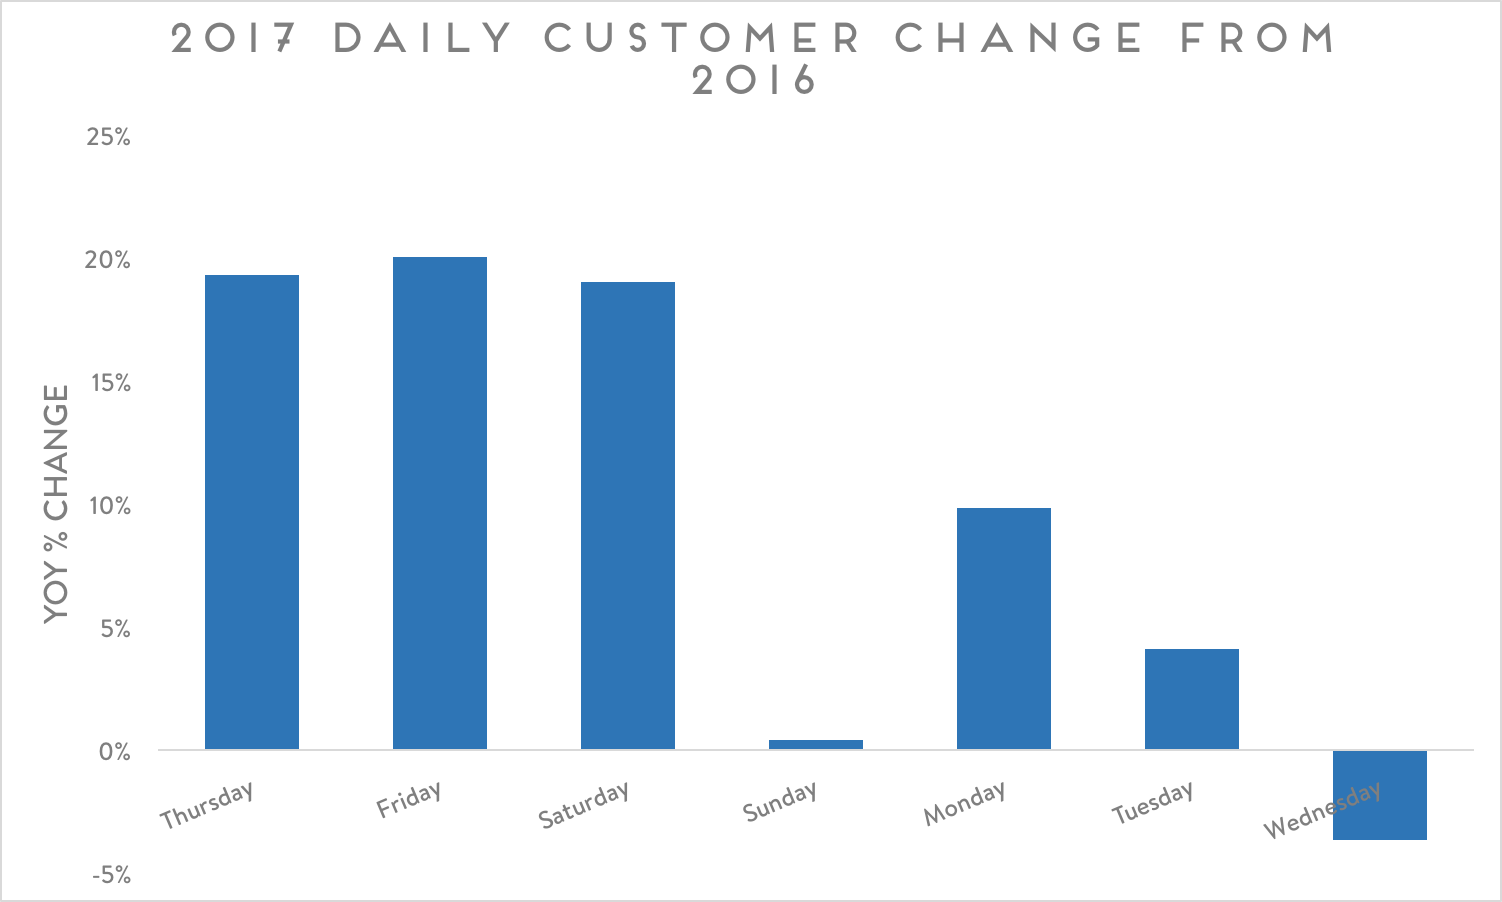
3) More Consumers Are Shopping Online
Finally, we’re seeing the overall increase in revenue come as a result of more consumers shopping online. This finding is not necessarily surprising, as the ability to shop from the comfort and quiet of your home is far less stressful than bearing the crowds that made Black Friday famous. We can confidently contribute the increase in ecommerce revenue for apparel retailers to an increase an individual shoppers because the spikes in customers shopping online each day match the spikes in revenue on those same days.
How Purchase Behavior Impacts Day-by-Day Revenue Spikes
Now that we know what ecommerce revenue performance for apparel retailers looked like in 2017 and how it compared to last year, what did the actual purchases look like?
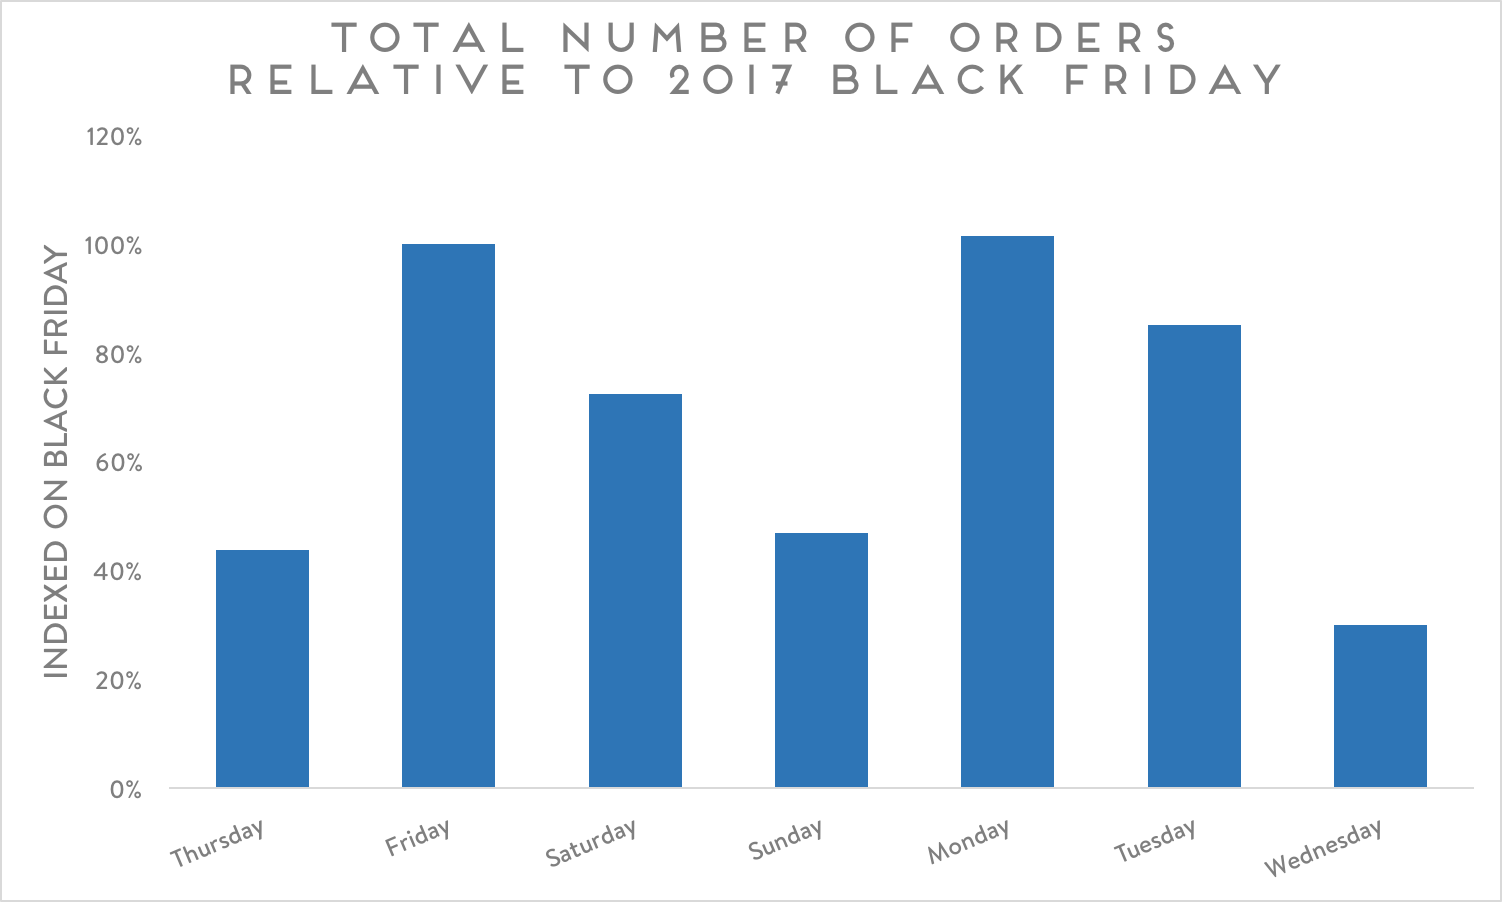
To start, we looked at the average number of ecommerce orders that shoppers placed each day of the week. The biggest spike in orders came on Cyber Monday (followed very closely by Black Friday), which is what drove Cyber Monday to be the biggest revenue day of the week. In general, the spikes in number of orders each day match the spikes in number of shoppers on those same days.
Next, we looked at the breakdown of average order value for the week and found that it decreased each day. And this is true from the very beginning, as Thanksgiving boasts the highest average order value for the entire week.
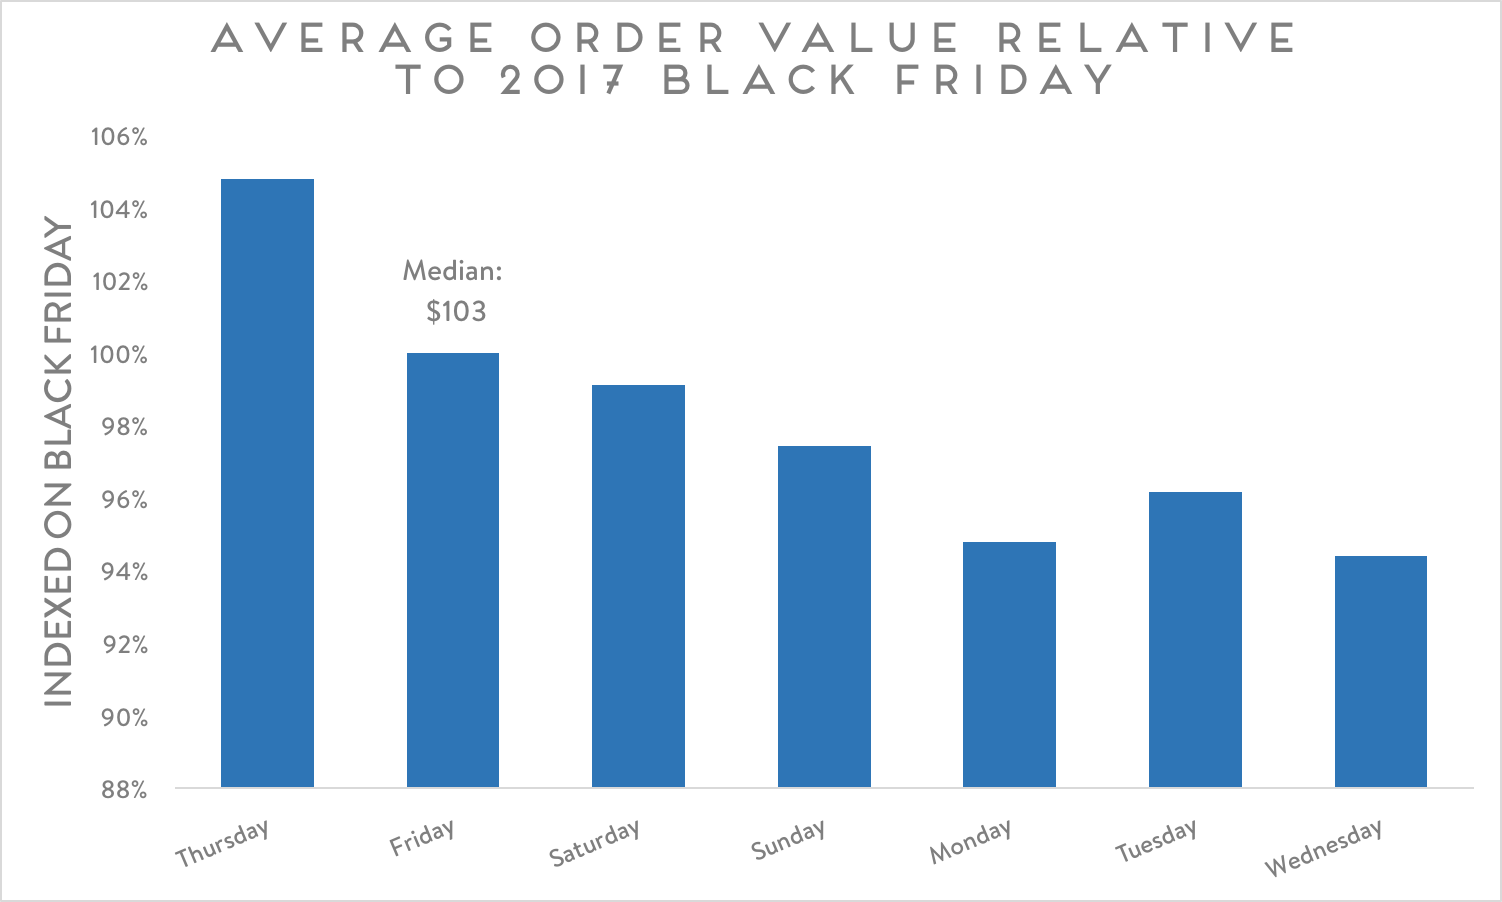
We suspect that average order value declined throughout the week because the number of items in each order also declined as the week went on. For reference, the median number of products per order on Black Friday was 2.3.
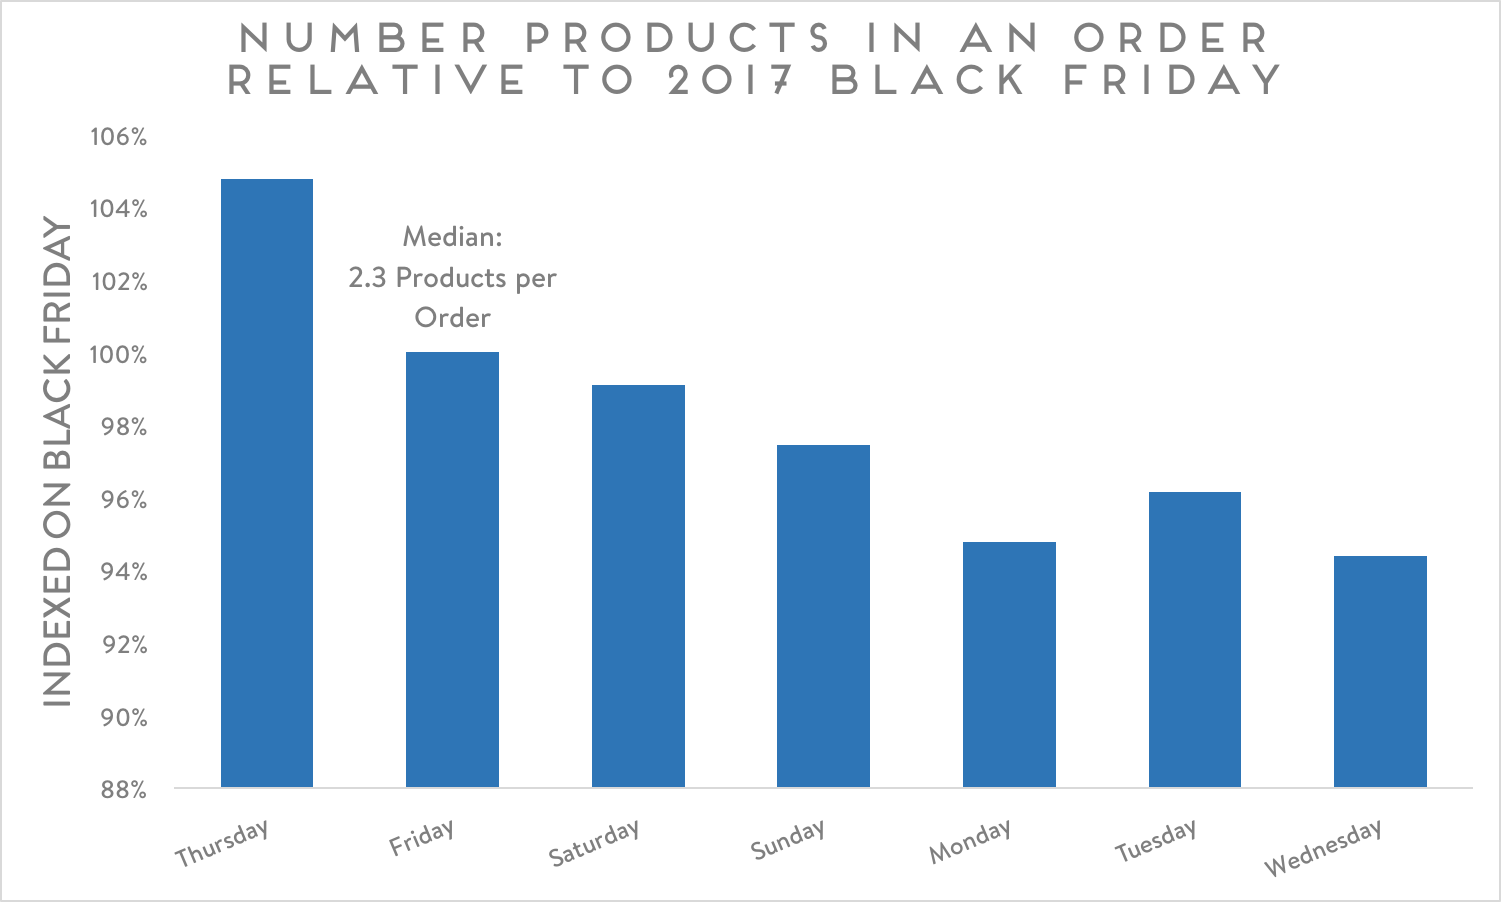
Essentially, this data reveals that while a higher volume of purchases (even if they did have a lower average order value and contained fewer items per order) drove revenue performance on Cyber Monday, a higher average order value (thanks in part to having more items per order) drove revenue performance on Thanksgiving Thursday, Black Friday and Saturday.
Responding to Shifts in Ecommerce Behavior Throughout the Holiday Season
We all know that ecommerce behavior changes throughout the holiday season, but taking the time to do an analysis like this to better understand exactly what those changes look like can make a big difference for retailers when it comes to determining the best way to approach marketing during this all-important time of the year.
With that in mind, as we see these shifts in ecommerce behavior throughout the holiday season, what are retailers doing to both prompt these increases in activity and react to them? Take a look at our infographic, The Retailer’s Guide to Holiday Emails, to find out.