


What the Latest Triggered Email Benchmarks Tell Us About Ecommerce Performance
We might only be one week into the new year, but chances are you’ve already had some sort of conversation about triggered email benchmarks in 2018.
It seems benchmarks have become something that no marketer can live without, and for good reason. The now ubiquitous nature of data has made it easier than ever to understand performance, and that has upped the game when it comes to measuring your progress over time and tracking how you stand up against your peers.
Feeding the Benchmark Beast: Bluecore’s Email Performance Calculator
To help feed the benchmark beast and shed light on triggered email performance for ecommerce, we launched an Email Performance Calculator last April. The idea was simple: Enter a few basic pieces of information about your retail vertical, average order value (over or under $100) and monthly unique visitors (over or under 300,000) to find the best triggered email benchmarks against which to measure your performance.
Since the initial launch, we’ve updated the data that goes into the calculator each quarter. Today, we’re updating the data once again, and this latest update brings us to a full year’s worth of data powering the benchmarks. Going forward, we will continue to update the data on a quarterly basis, phasing out older data so that we always have a rolling year’s worth of triggered email data powering the benchmarks.

Behind the Data: What the Benchmarks Tell Us About Ecommerce Triggered Email Performance
Although our primary intention for the Email Performance Calculator was to provide a fast and convenient way for ecommerce marketers to get customized triggered email performance benchmarks, the tool has taken on a life of its own since it first launched.
Each quarter, we’ve dug into the data to find new trends, better understand how retailers are approaching triggered email campaigns and provide advice on different ways to use the data to improve triggered email performance.
Now that we have a full year’s worth of data, we expect to see a lot more stability in the benchmarks going forward. That said, overall, the metrics fall in line with some of the key stories we’ve shared before, including the relationship between open, click and conversion rates, the impact of average order value on triggers and the increasing maturity of triggered email programs.
A Year of Triggered Emails: Breaking Down the Benchmark Data
So what trends did we find in the data this time around? We found the most interesting story by looking at how the full year’s worth of data breaks down quarter over quarter. In particular, we learned:
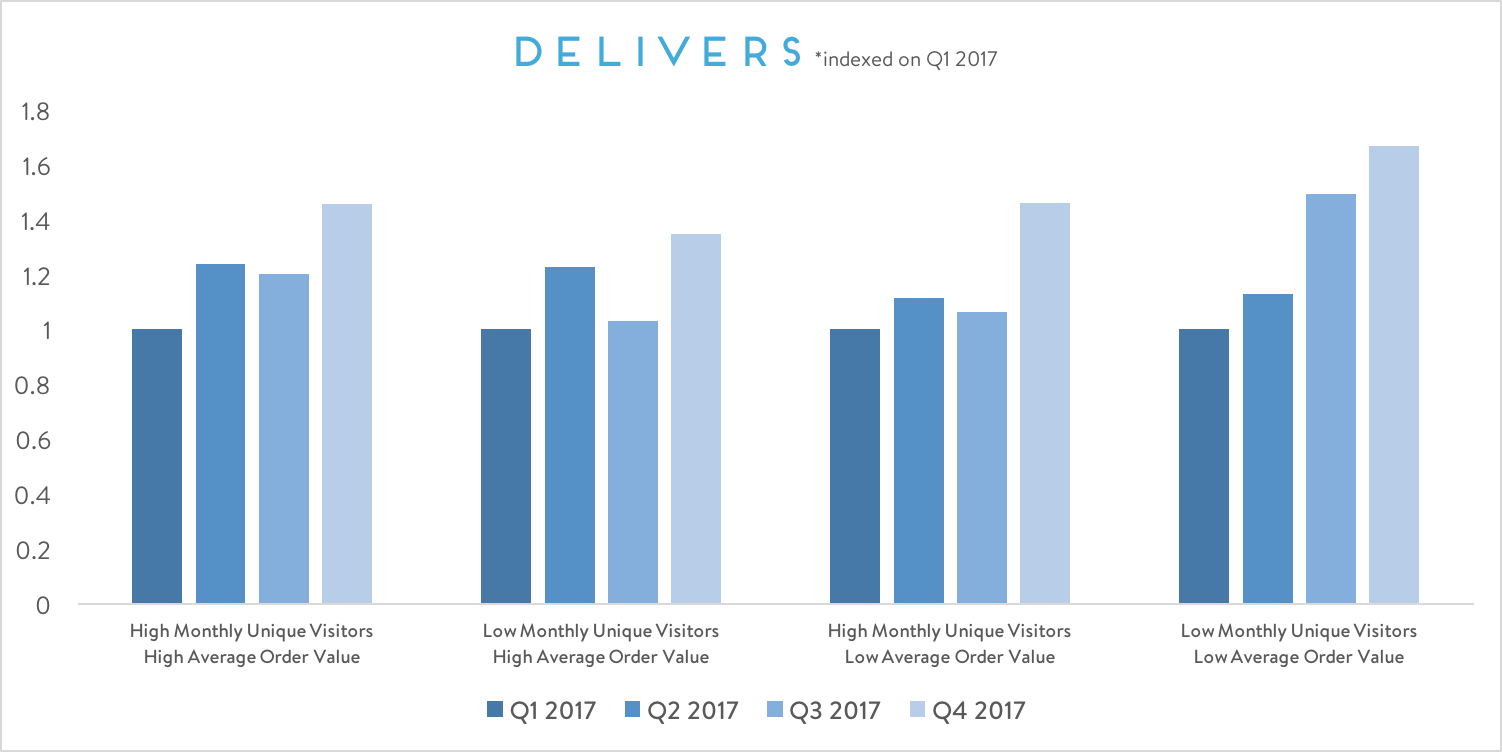
The benchmarks for average open rates and click rates decrease slightly each quarter. However, average delivers increase for the most part, and this increase has an impact on the open and click benchmarks. That’s because the larger the send volume, the lower the follow-on metrics tend to be since you need significantly more raw opens and clicks to hit similar percentages.
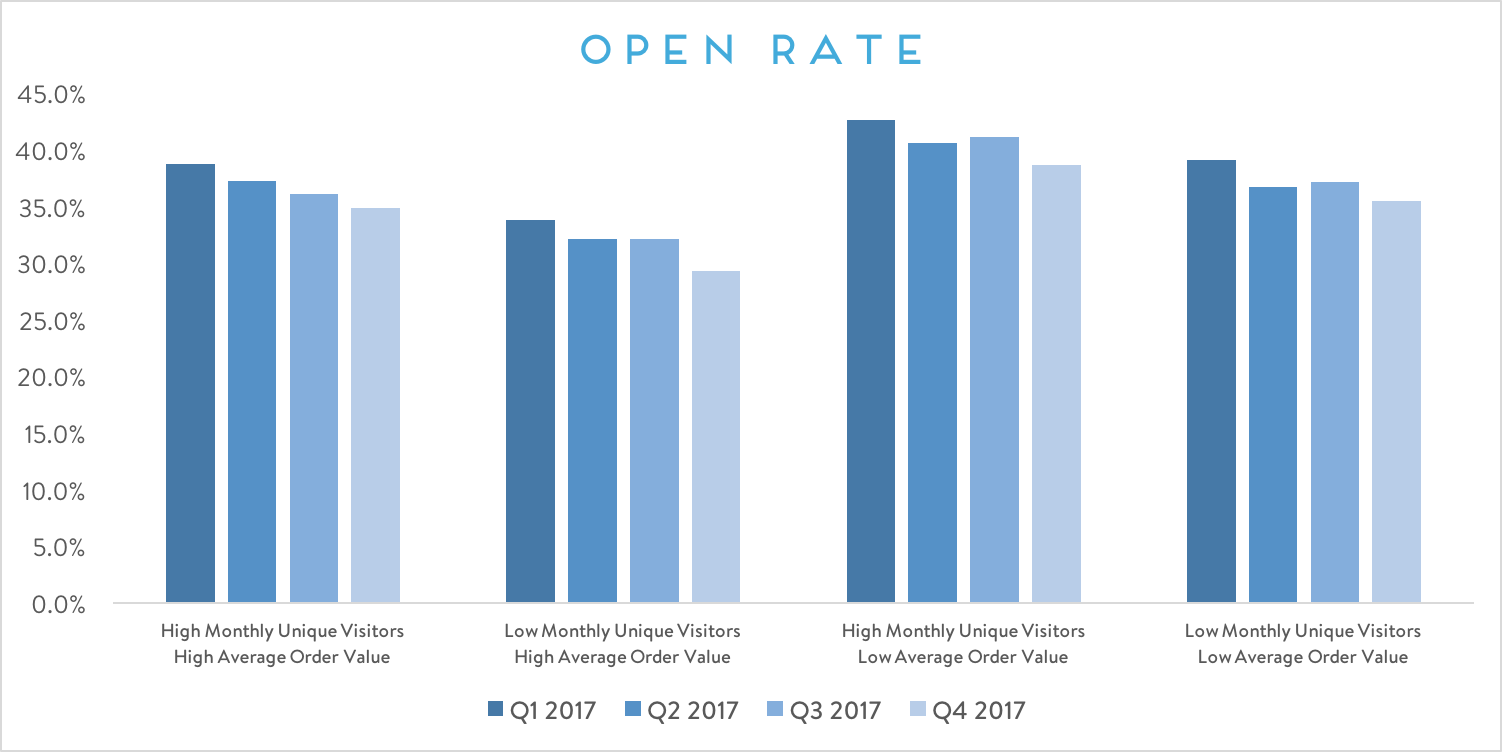
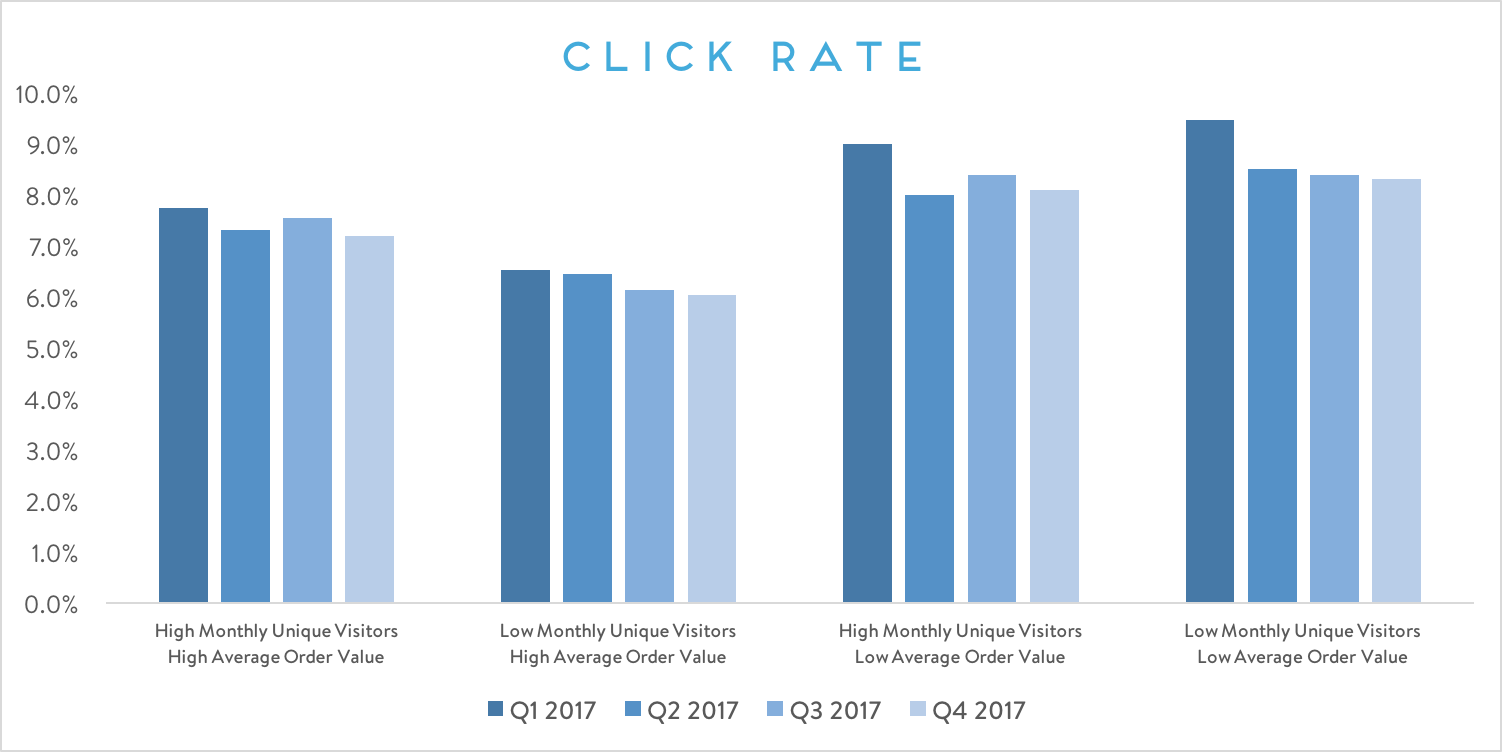
Diving deeper into delivers, we see fairly subtle increases over the first three quarters (compared to a baseline of Q1), with a huge jump in the fourth quarter. This jump is not surprising given how ecommerce activity explodes during the holiday season. It also makes the only slight dip in open and click rate benchmarks during the fourth quarter even more impressive.
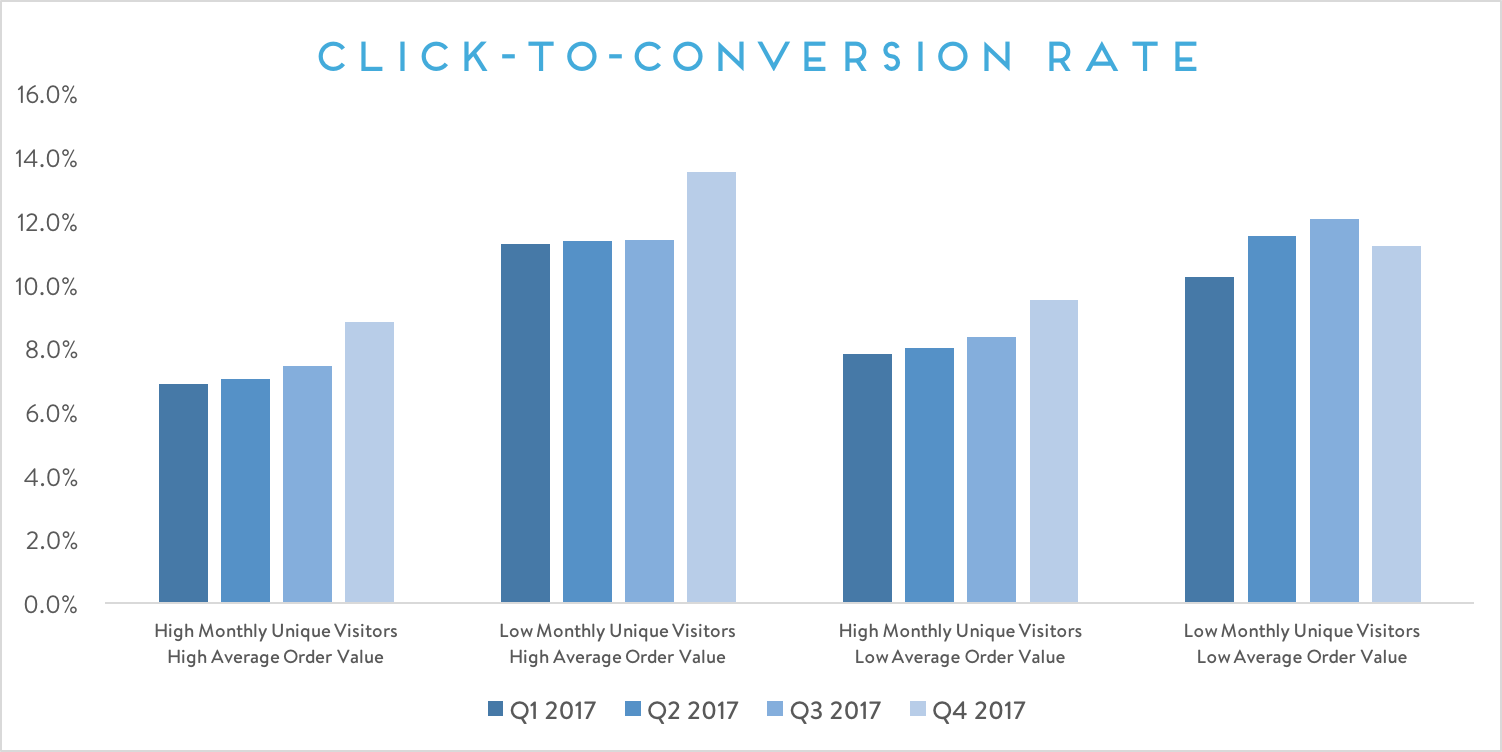
One of the most interesting findings in the benchmark data relates to click-to-conversion rates. We see this number increase significantly in Q4 across the board (with the exception of retailers that fall into the bucket of lower monthly unique visitors and lower average order value). This finding supports the idea that people make more purchases during the holiday season. While that finding in and of itself might not be groundbreaking, there’s a key lesson in it. And that’s when it comes to getting the most out of your triggered emails, the most important thing is to think about the bigger picture.
The most successful ecommerce marketers are those that view their triggered emails as one part of a bigger customer journey. Instead of just looking at an individual email, they look at how all of the emails they send fit together to create an experience stream that carries customers through a journey over the entire year. Essentially, the end of the year presents a strong opportunity to lock in sales after spending the past year engaging with customers in a personalized way.
To Get the Most Out of Your Triggered Emails, Think Big Picture
Remember: When it comes to triggered email performance, a single email can’t tell the whole story. You need to step back and look at how all your triggers work together to help customers convert — even if that takes some time.
With all of that in mind, how does your triggered email performance stack up? Head on over to our Email Performance Calculator to find out!